View details and evaluate generated dataset
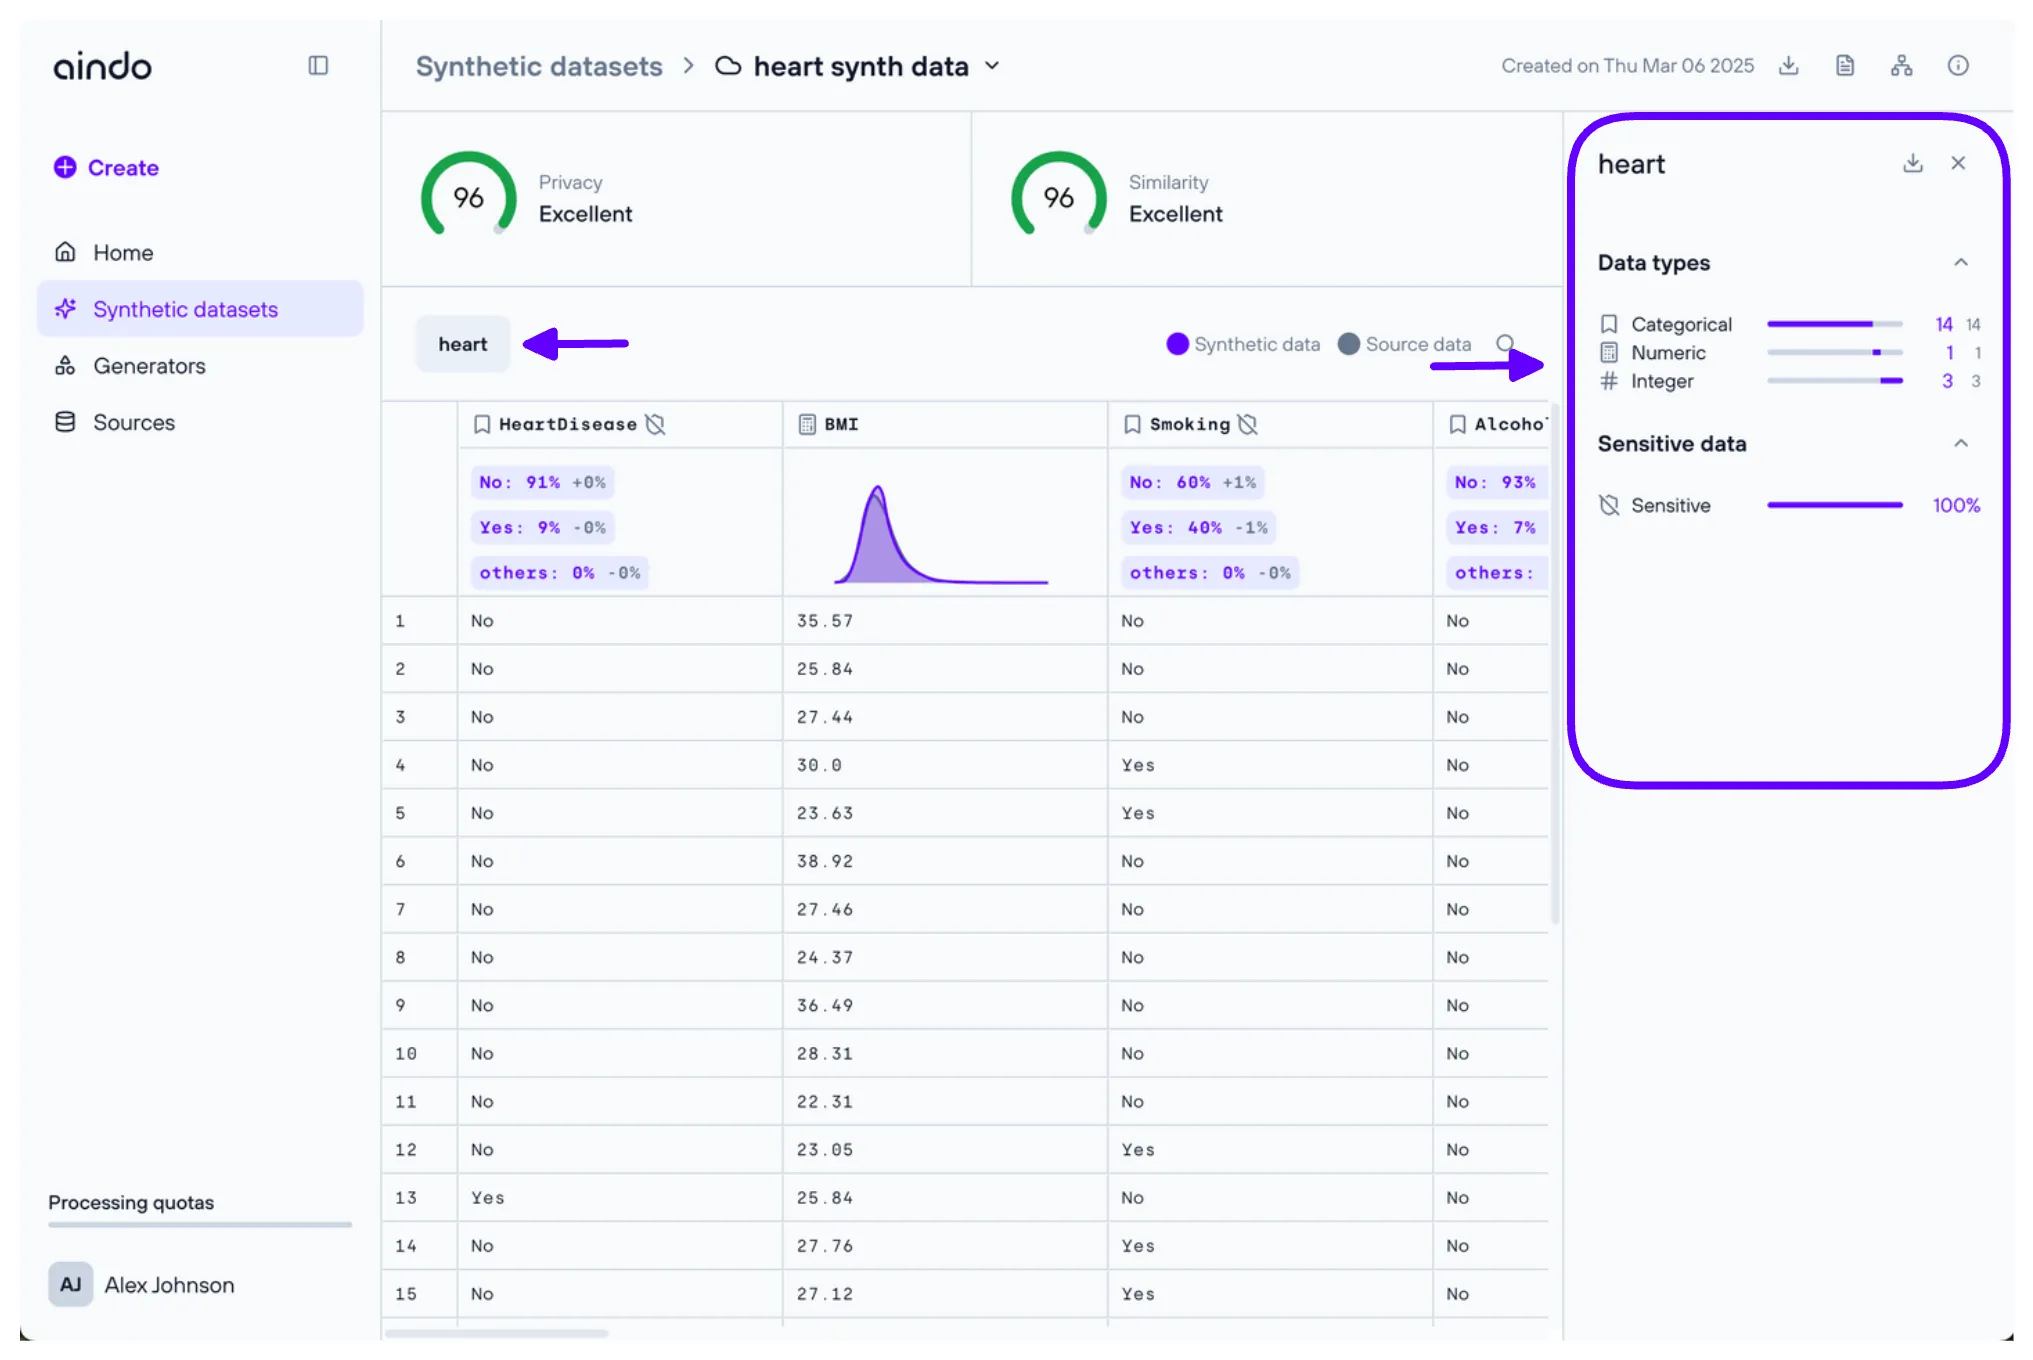
The Aindo Synthetic Data Platform provides a preview of the generated dataset you created with a generator. It also includes evaluation metrics to assess both the quality and privacy protection of the generated generated datasets. Below is an overview of the viewing and evaluation features.
Quick details on the list page
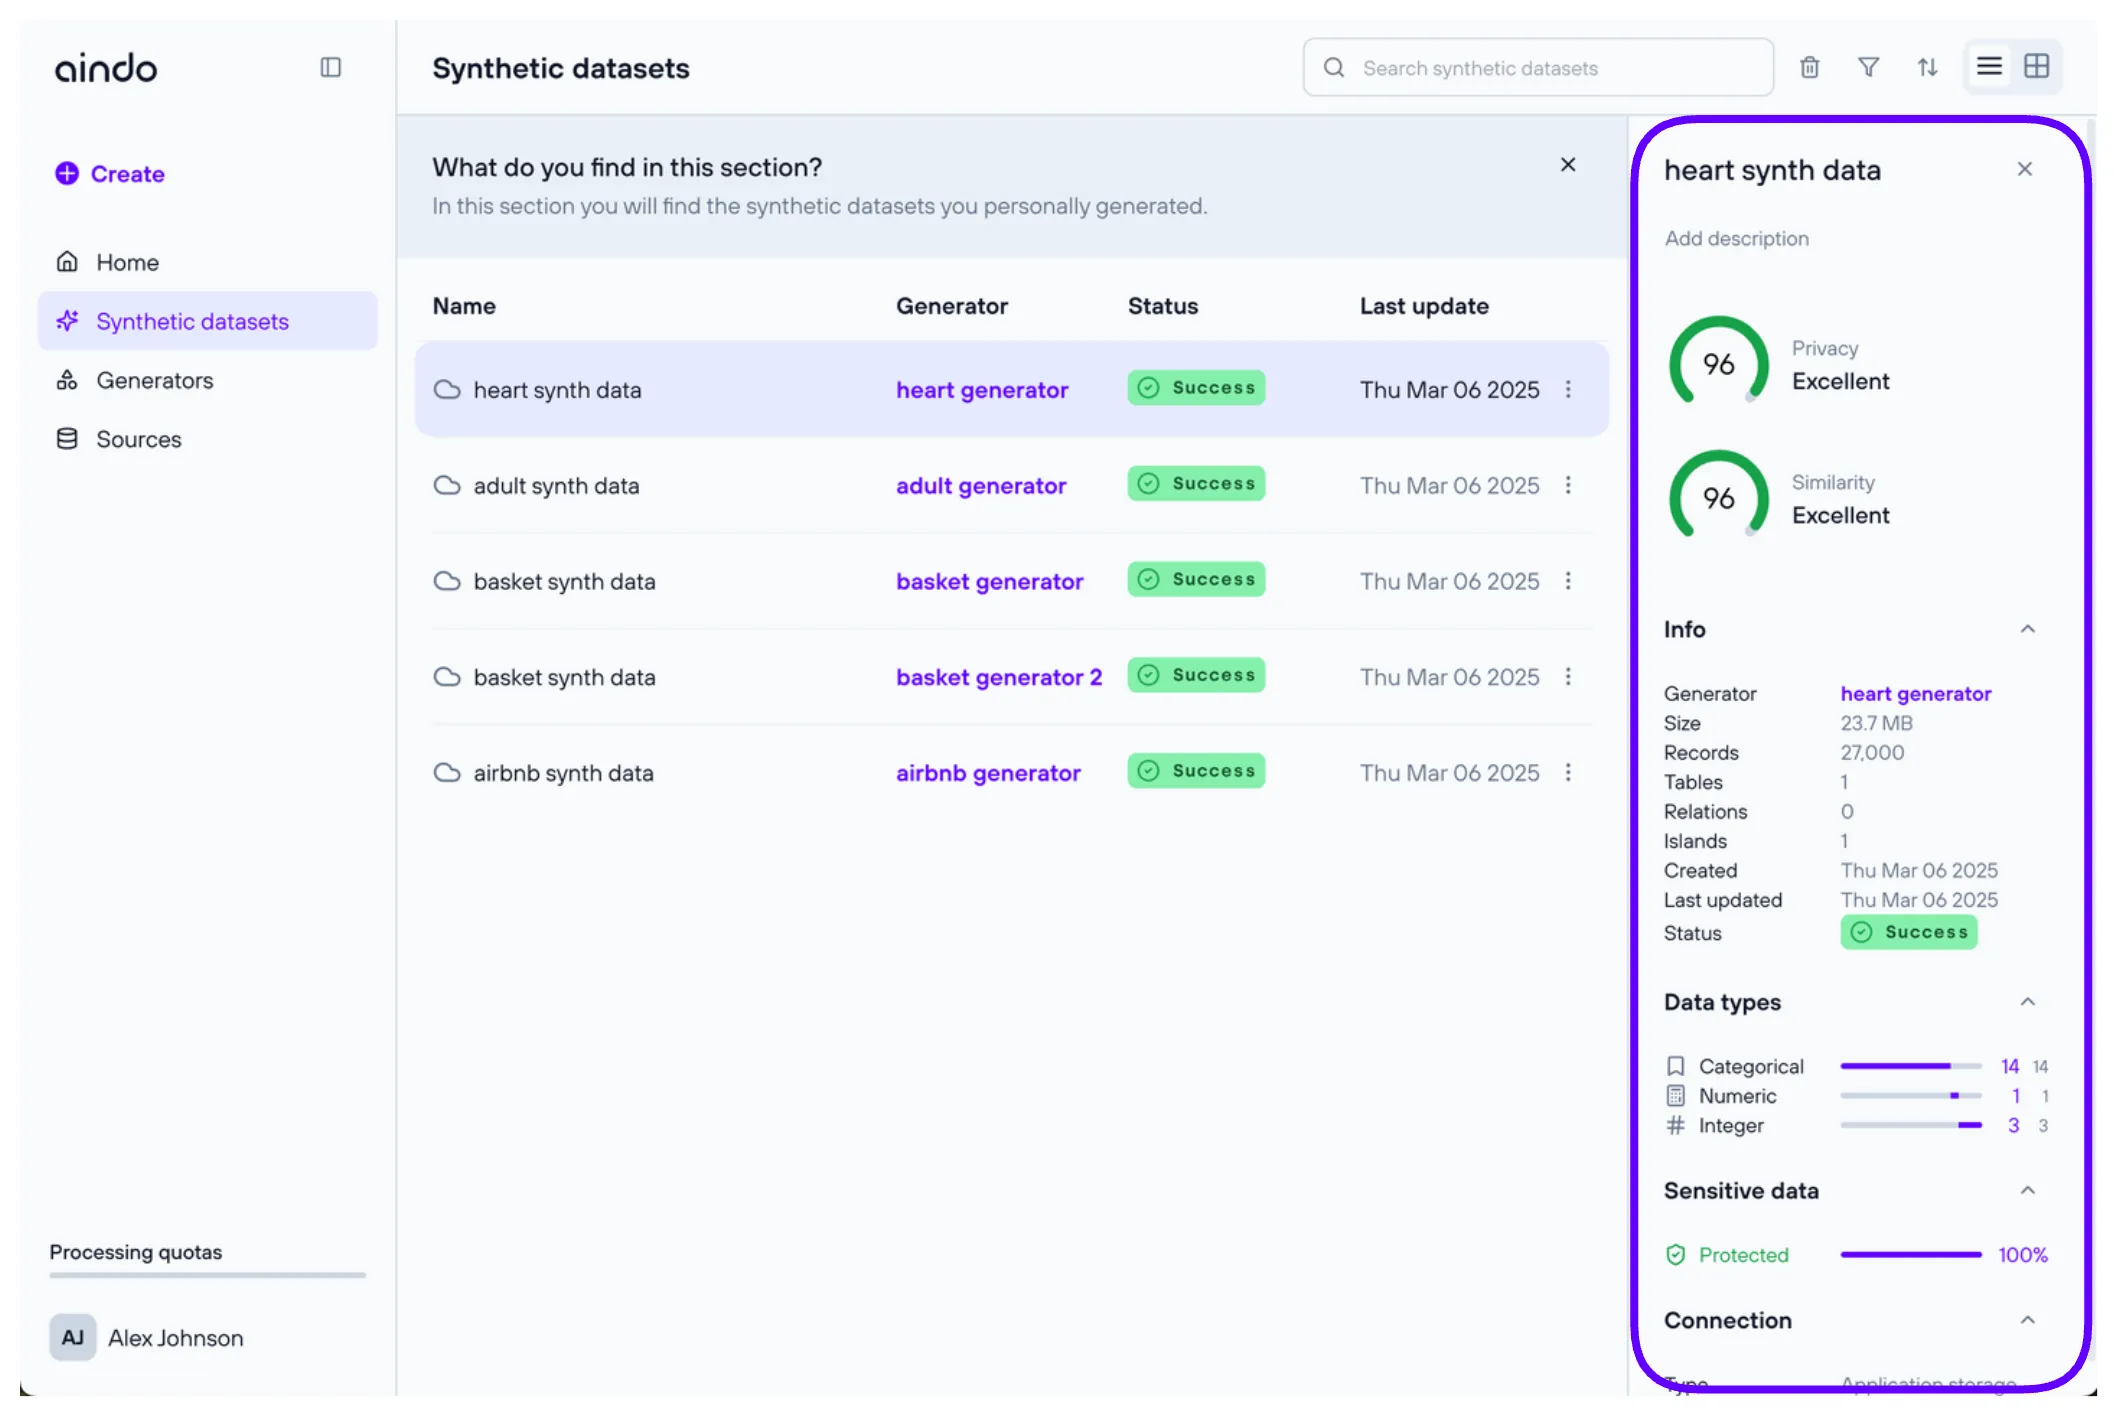
On the generated dataset list page, click on a generated dataset to open a side panel displaying general information, including evaluation scores, the generator used, and data types.
View page
To open a generated dataset, double-click on it from the list page.
Generation Stages
Click the “Generation stages” icon in the top right corner of the view page to open the “Generation Stages” dialog, listing every stage of the generation pipeline:
- Data Loading
- Tabular Preprocessing
- Text Preprocessing
- Tabular Synthesis
- Report
- Text Synthesis
- Anonymization (anonymization generators only)
- Data Writing
Not every stage applies to every generator: text stages only appear when the source data has textual columns, and the Anonymization stage only applies to anonymization generators.
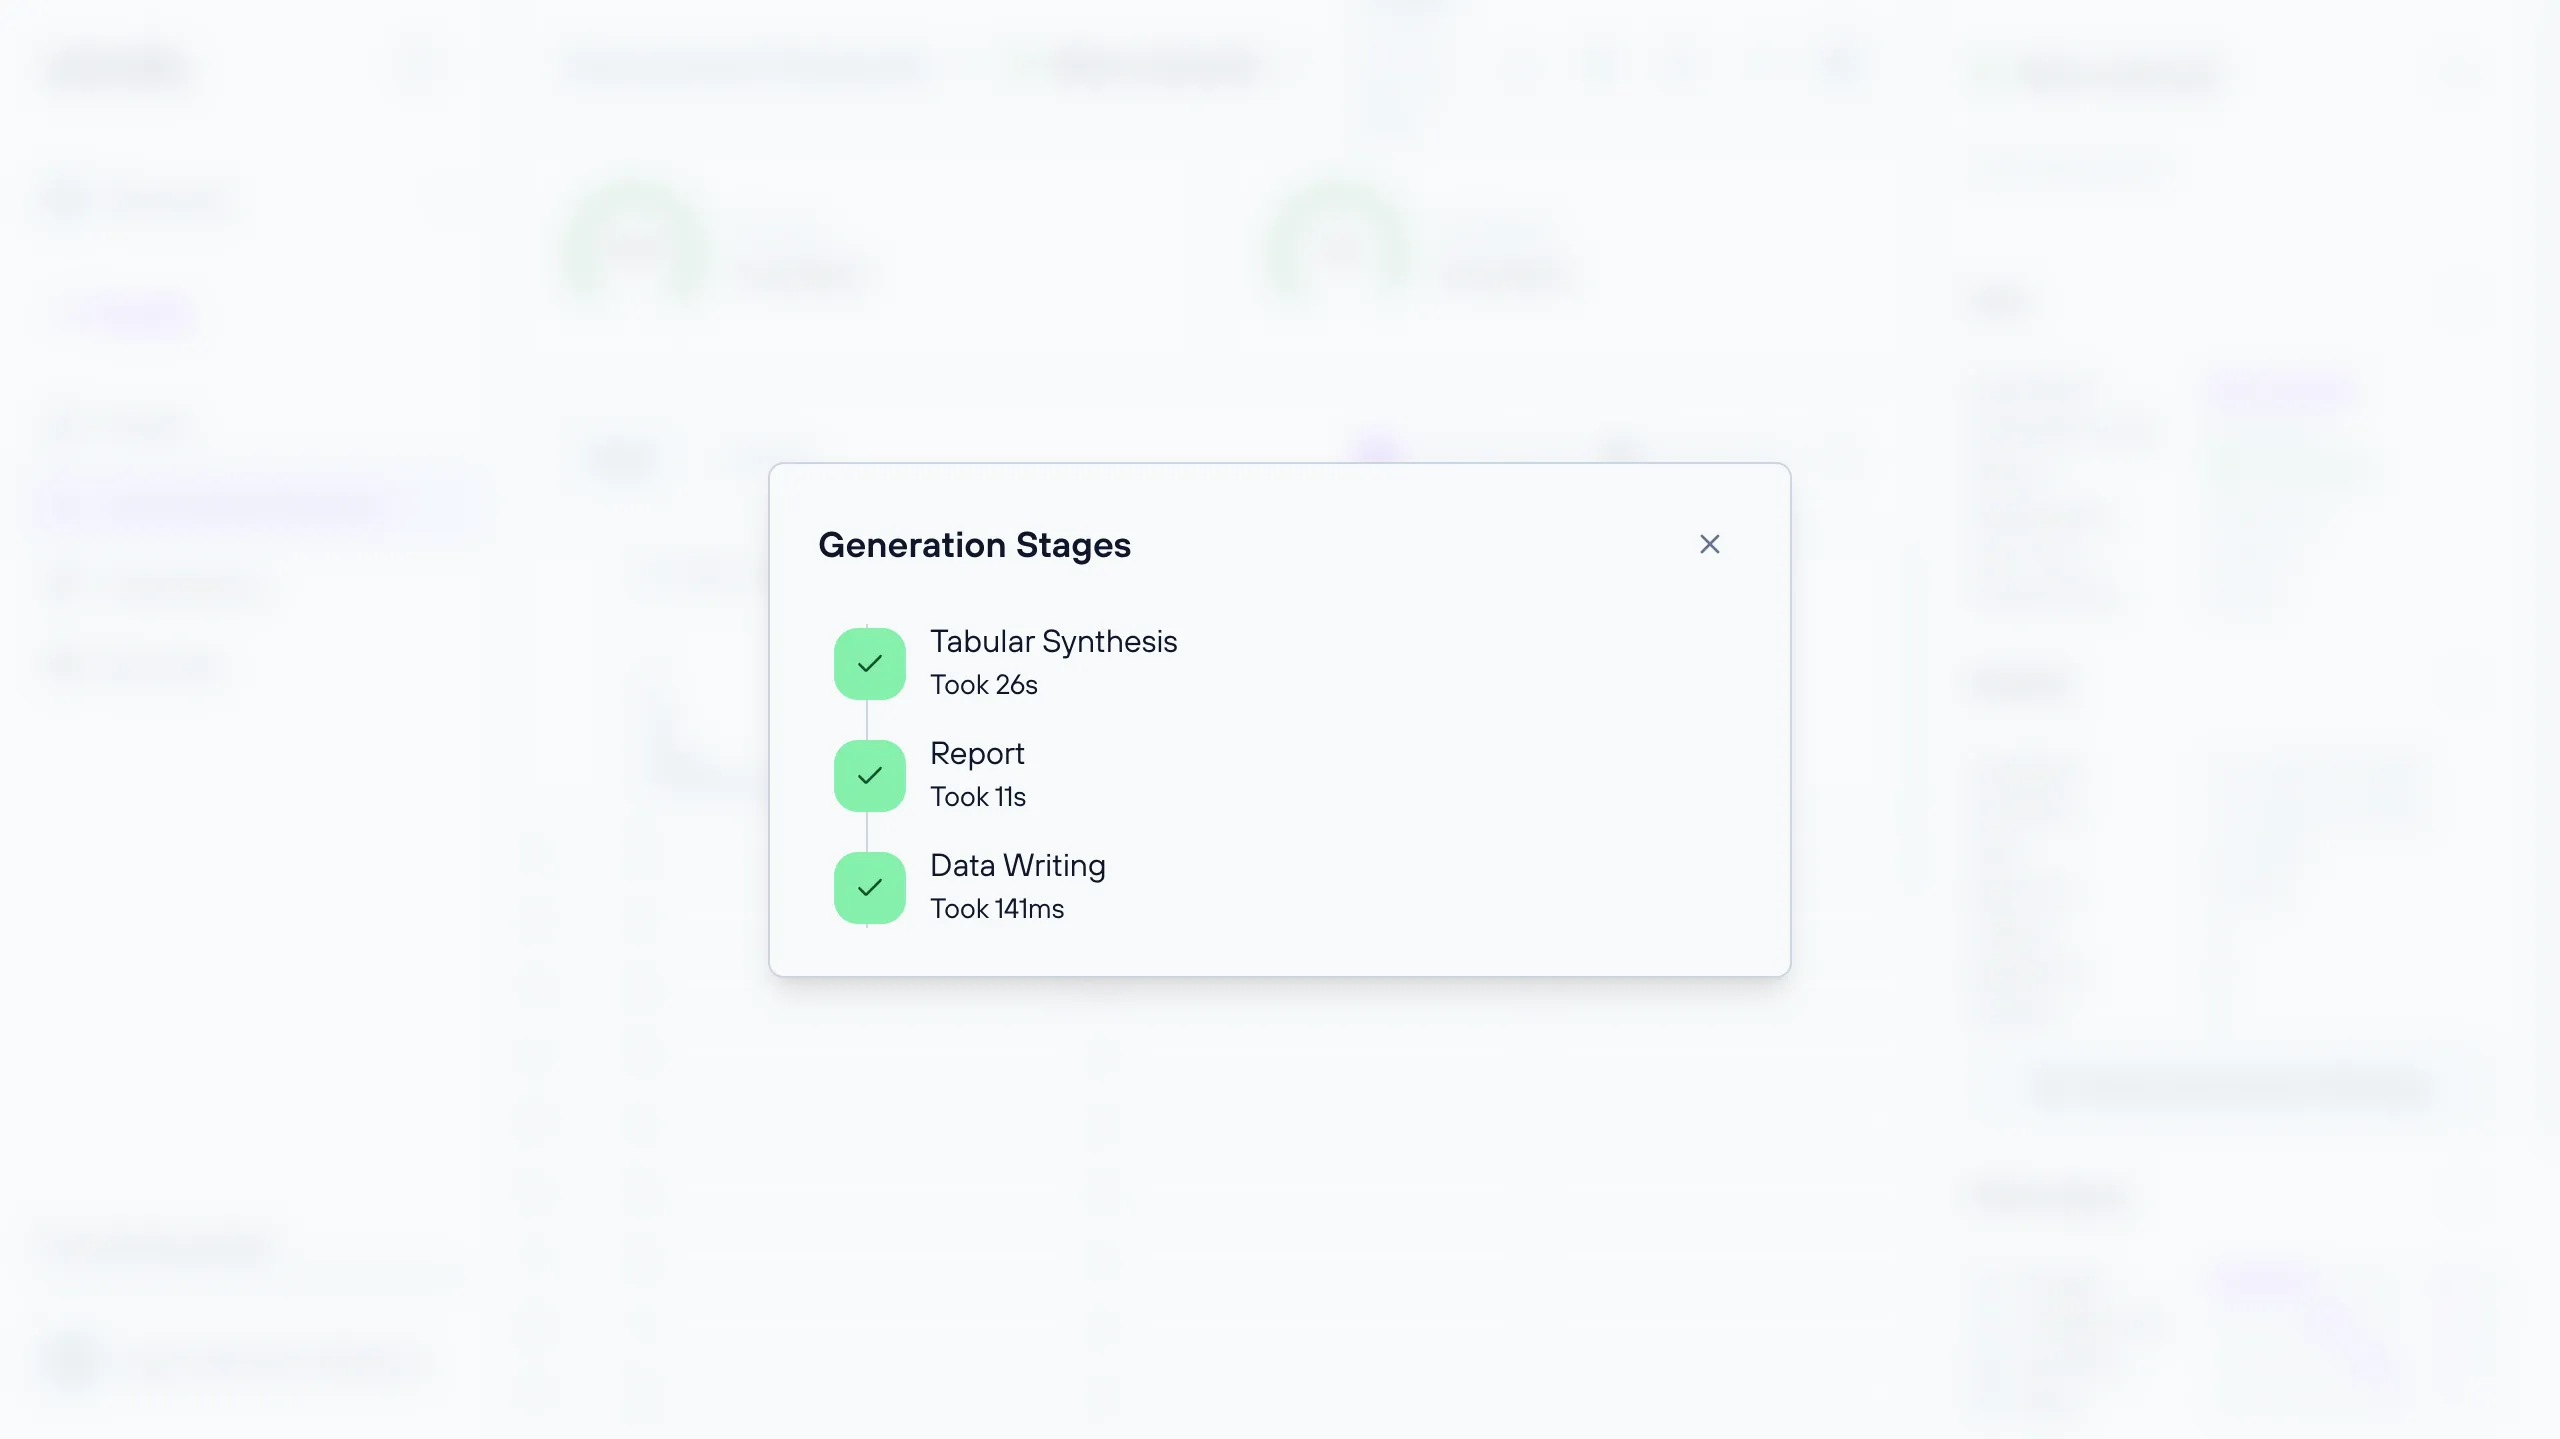
For each stage, the dialog shows:
Pending, if the stage has not started yet.Elapsed time: <duration>while the stage is running, orTook <duration>once it has finished.AbortedorErrorif the stage did not complete successfully.
This same stage timeline is also shown inline on the view page itself, in place of the data preview, while a generation is pending, running, cancelled, or failed.
Cancelling a generation
While a generation is pending or running, a ‘Cancel’ button below the stage timeline lets you abort it. Clicking it opens a confirmation dialog.
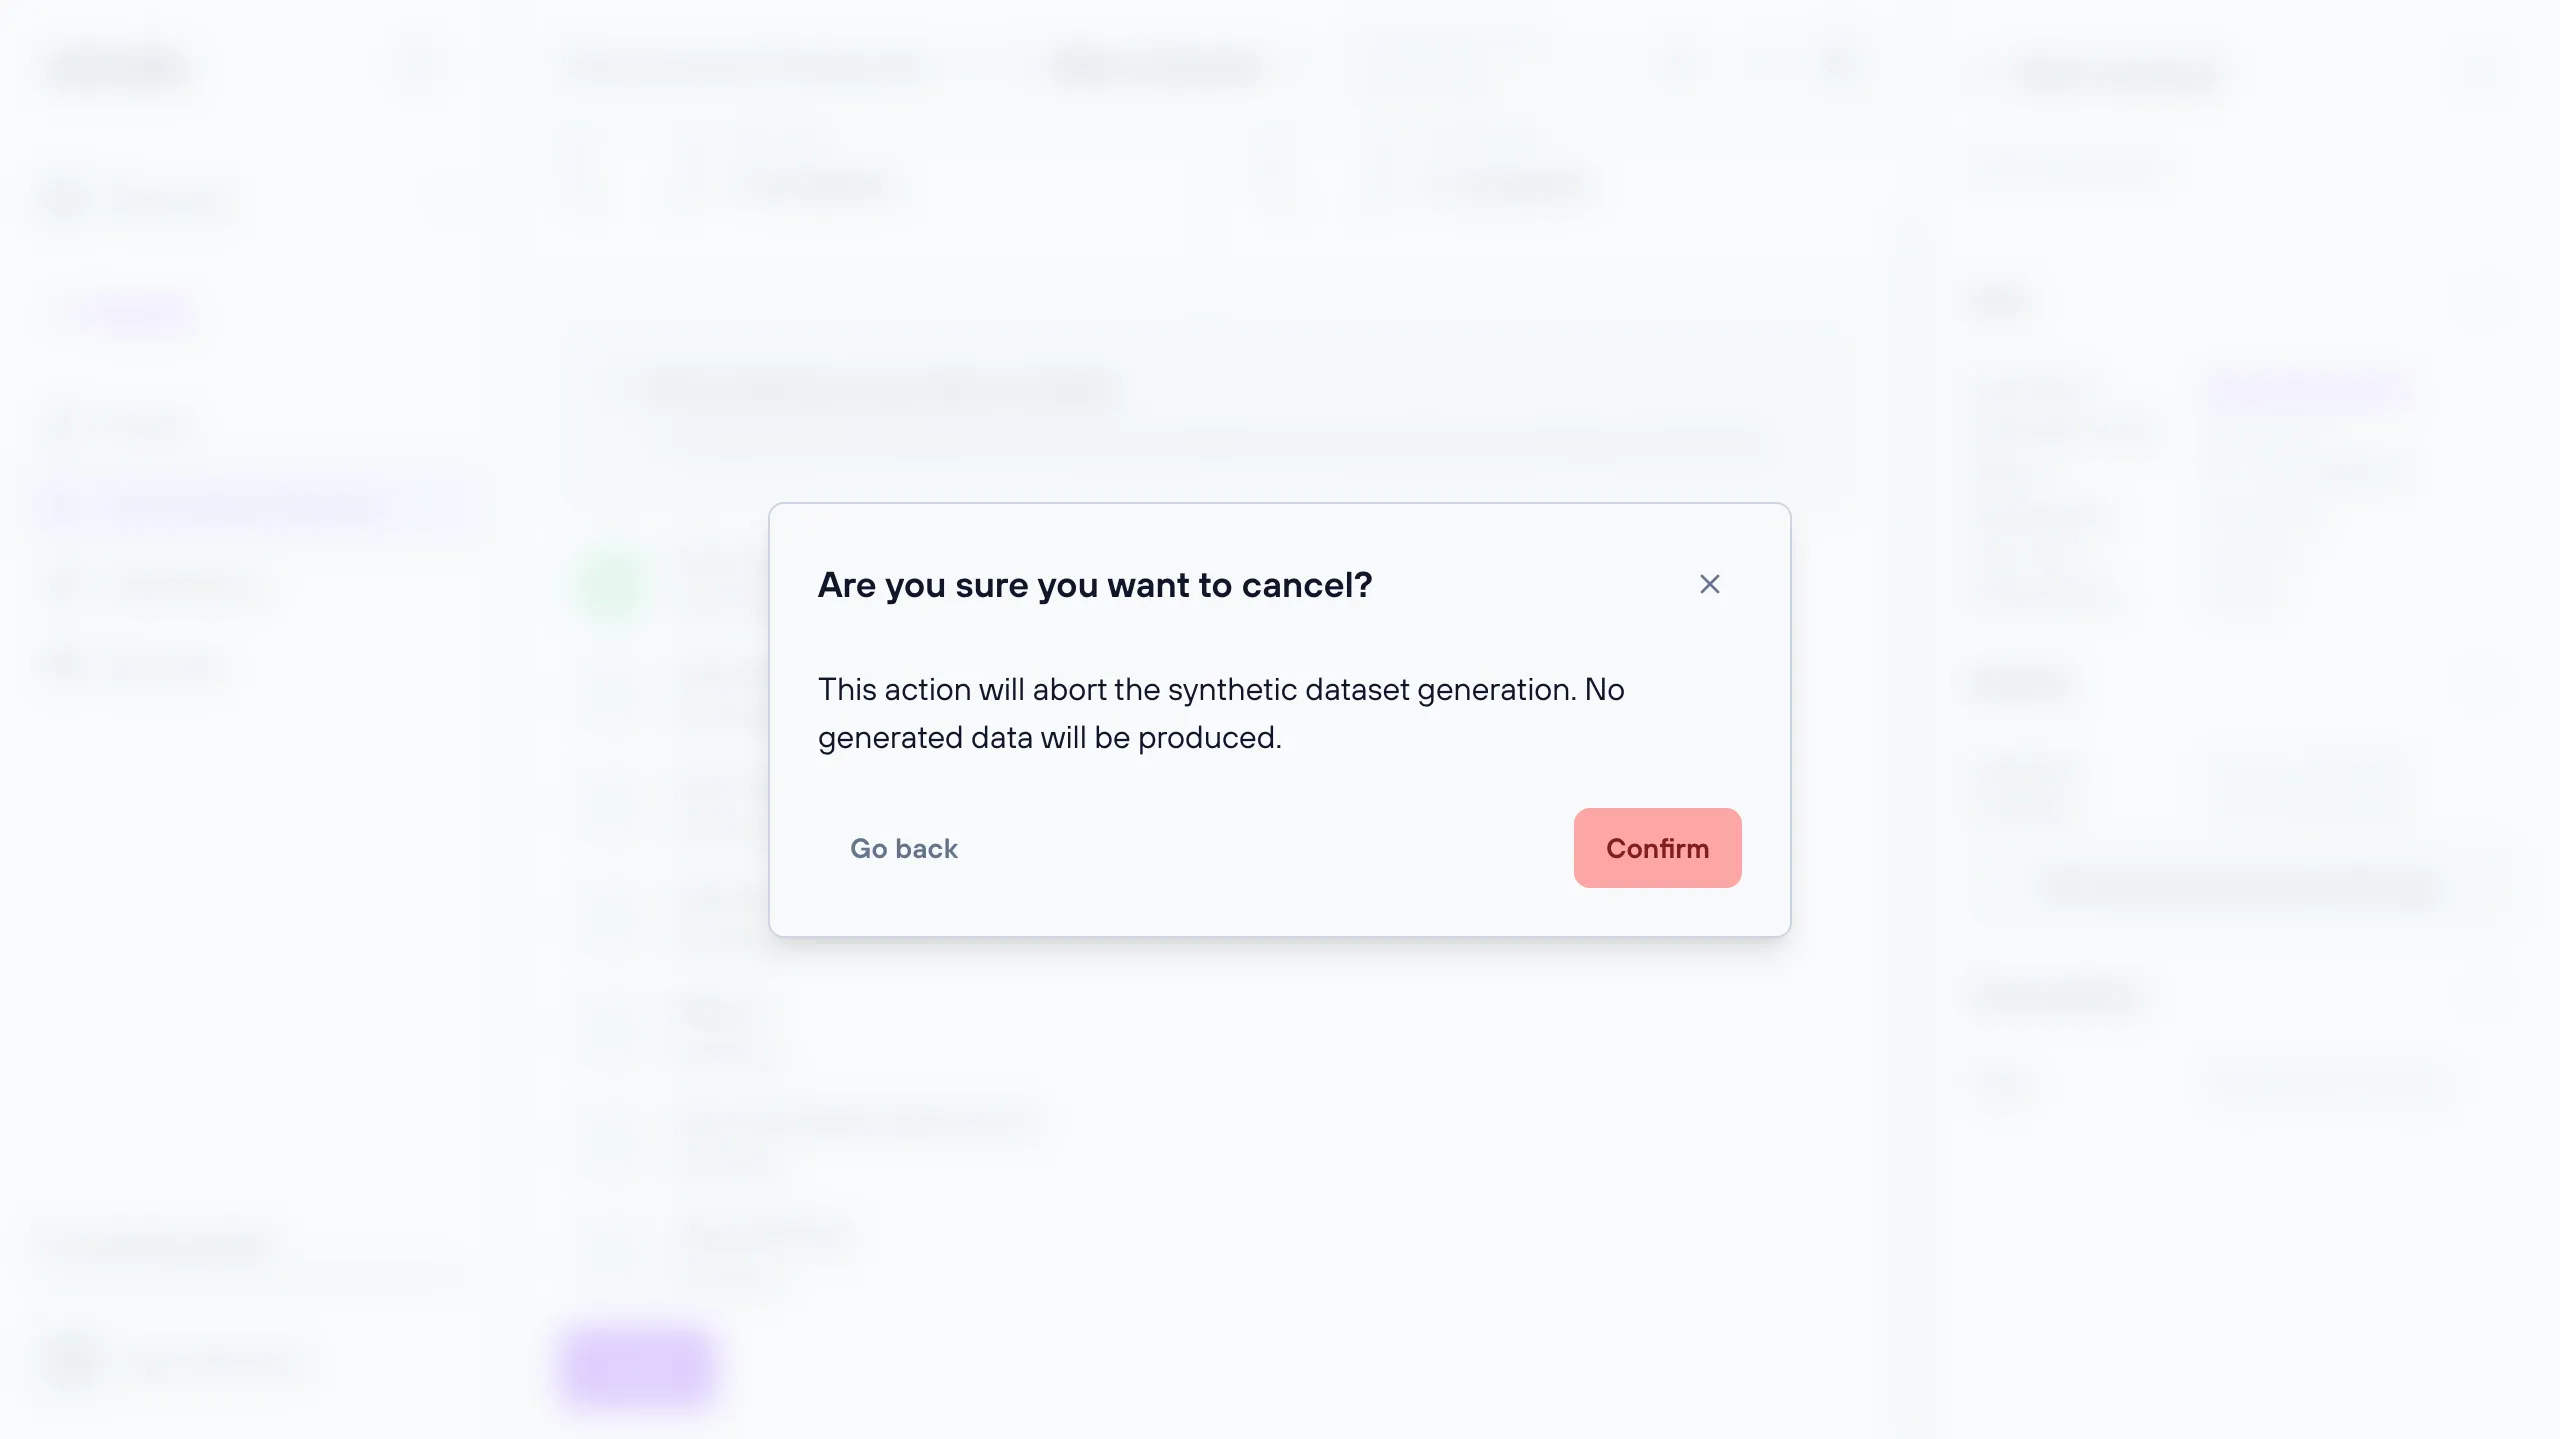
Confirming the dialog aborts the generation; no generated data will be produced, and no data preview will be available for this generated dataset.
Evaluation scores
At the top of the generated dataset view page, once generation has completed, two important metrics provide insights into the quality of the generated data:
- Privacy score: Indicates how well the generated synthetic data protects the privacy of real data subjects on a scale from 0 (all private information leaked) to 100 (no private information leaked). The privacy score is based on similarity metrics, a widely accepted approach to measuring privacy protection in synthetic and anonymized datasets.
- Similarity score: Indicates how well the synthetic data preserves the properties of the real data source on a scale from 0 (no information preserved) to 100 (all information relevant in analytics, software testing, research, AI development preserved). The similarity score is an aggregation of multiple widely accepted data fidelity and utility metrics.
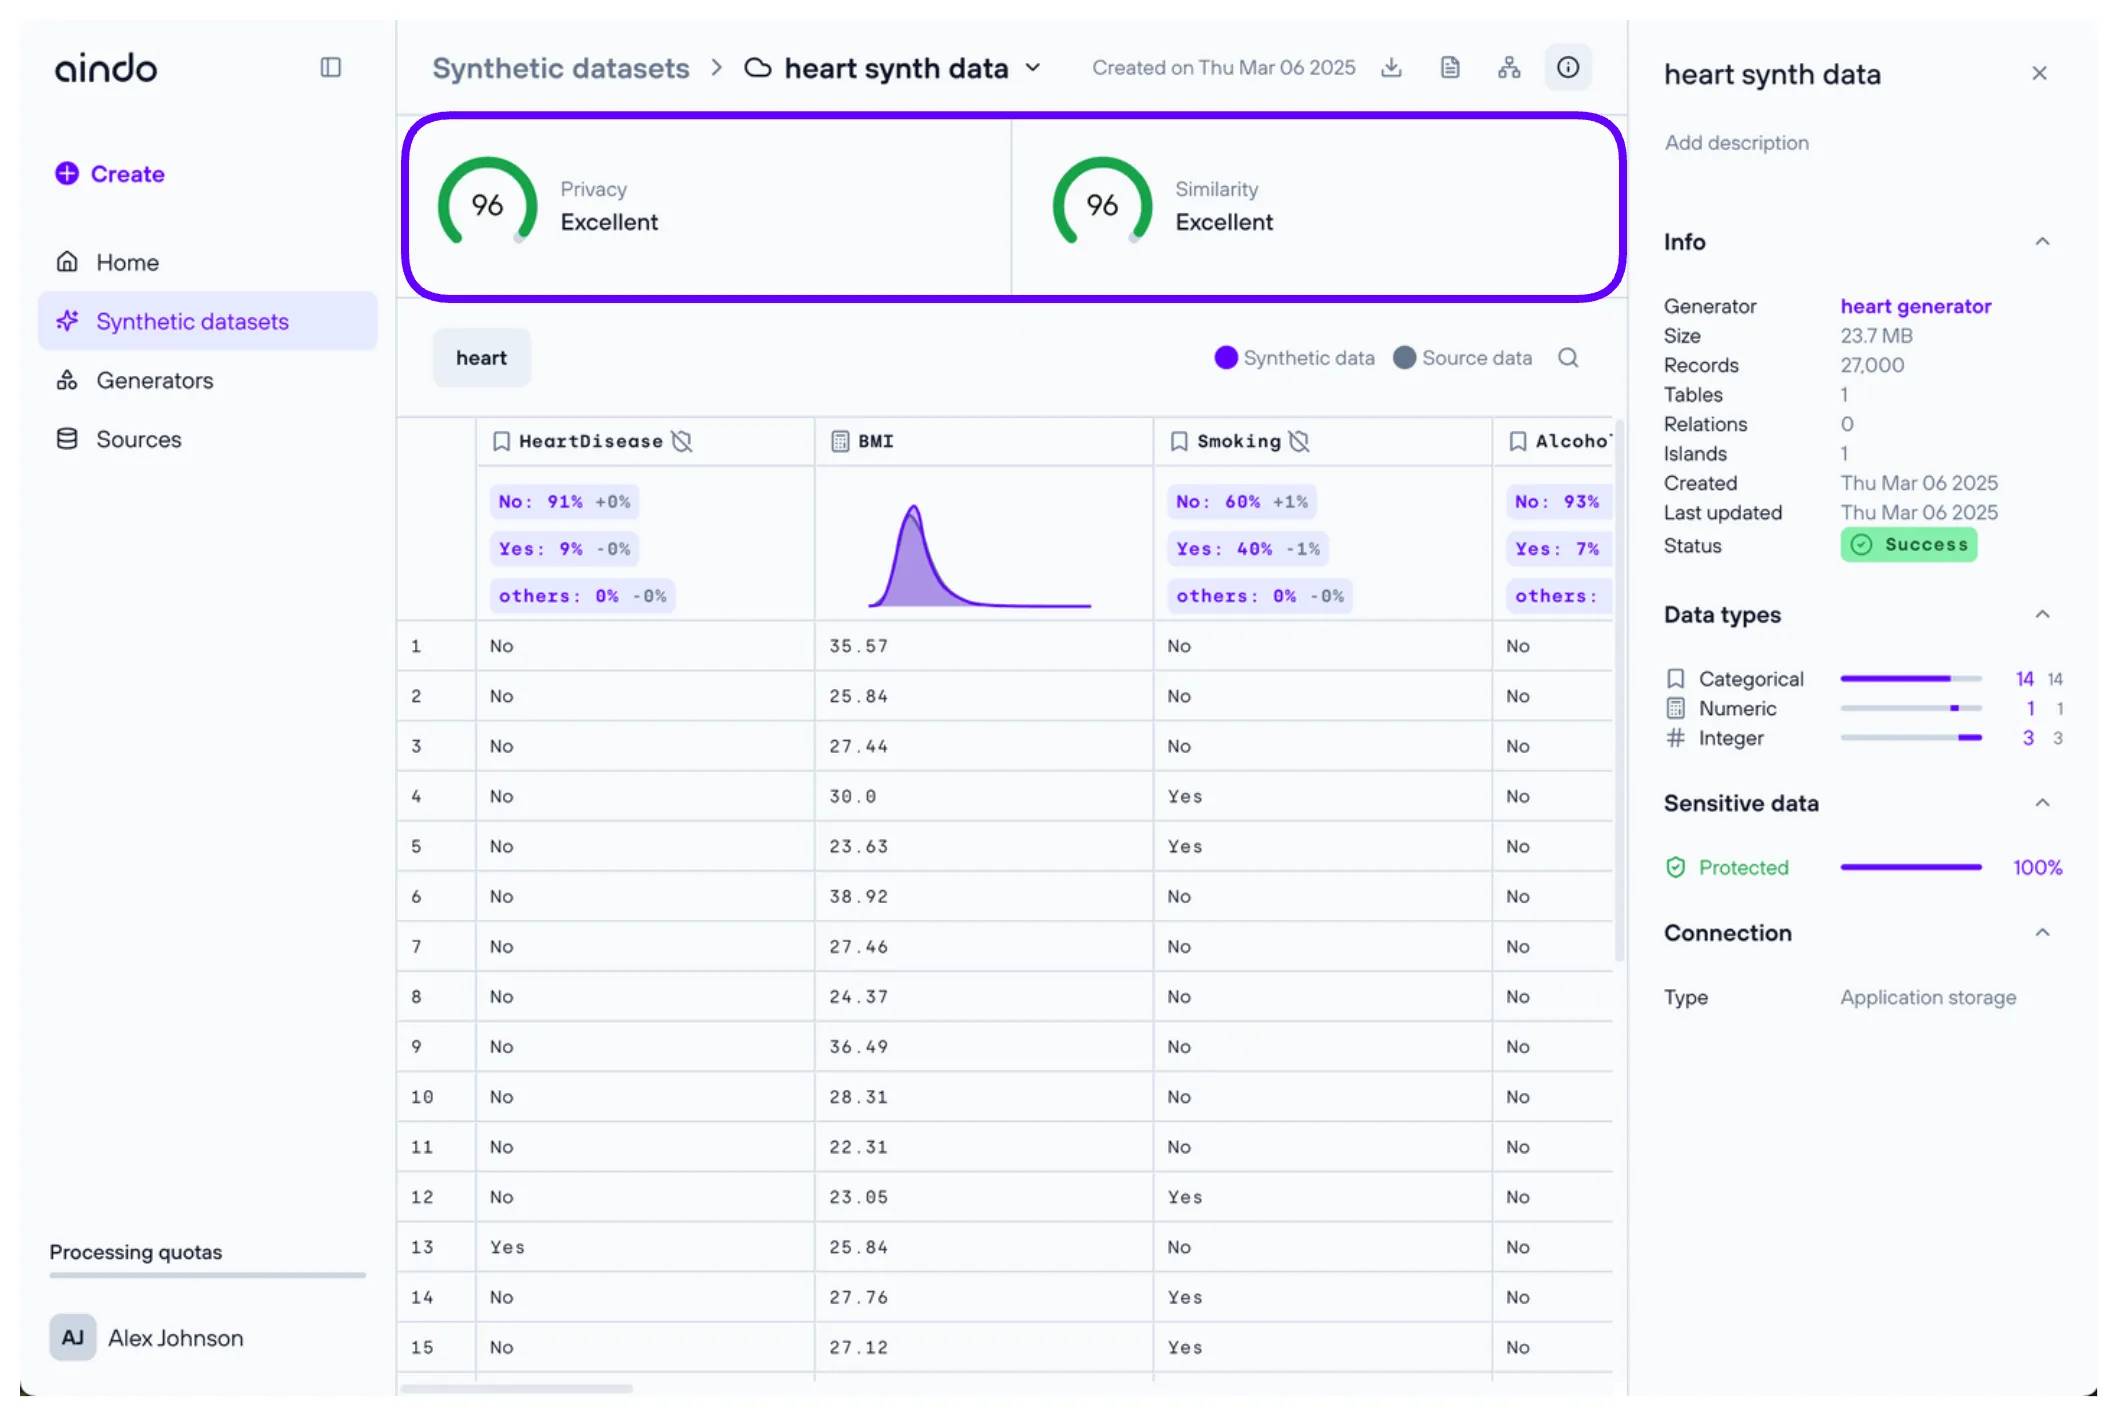
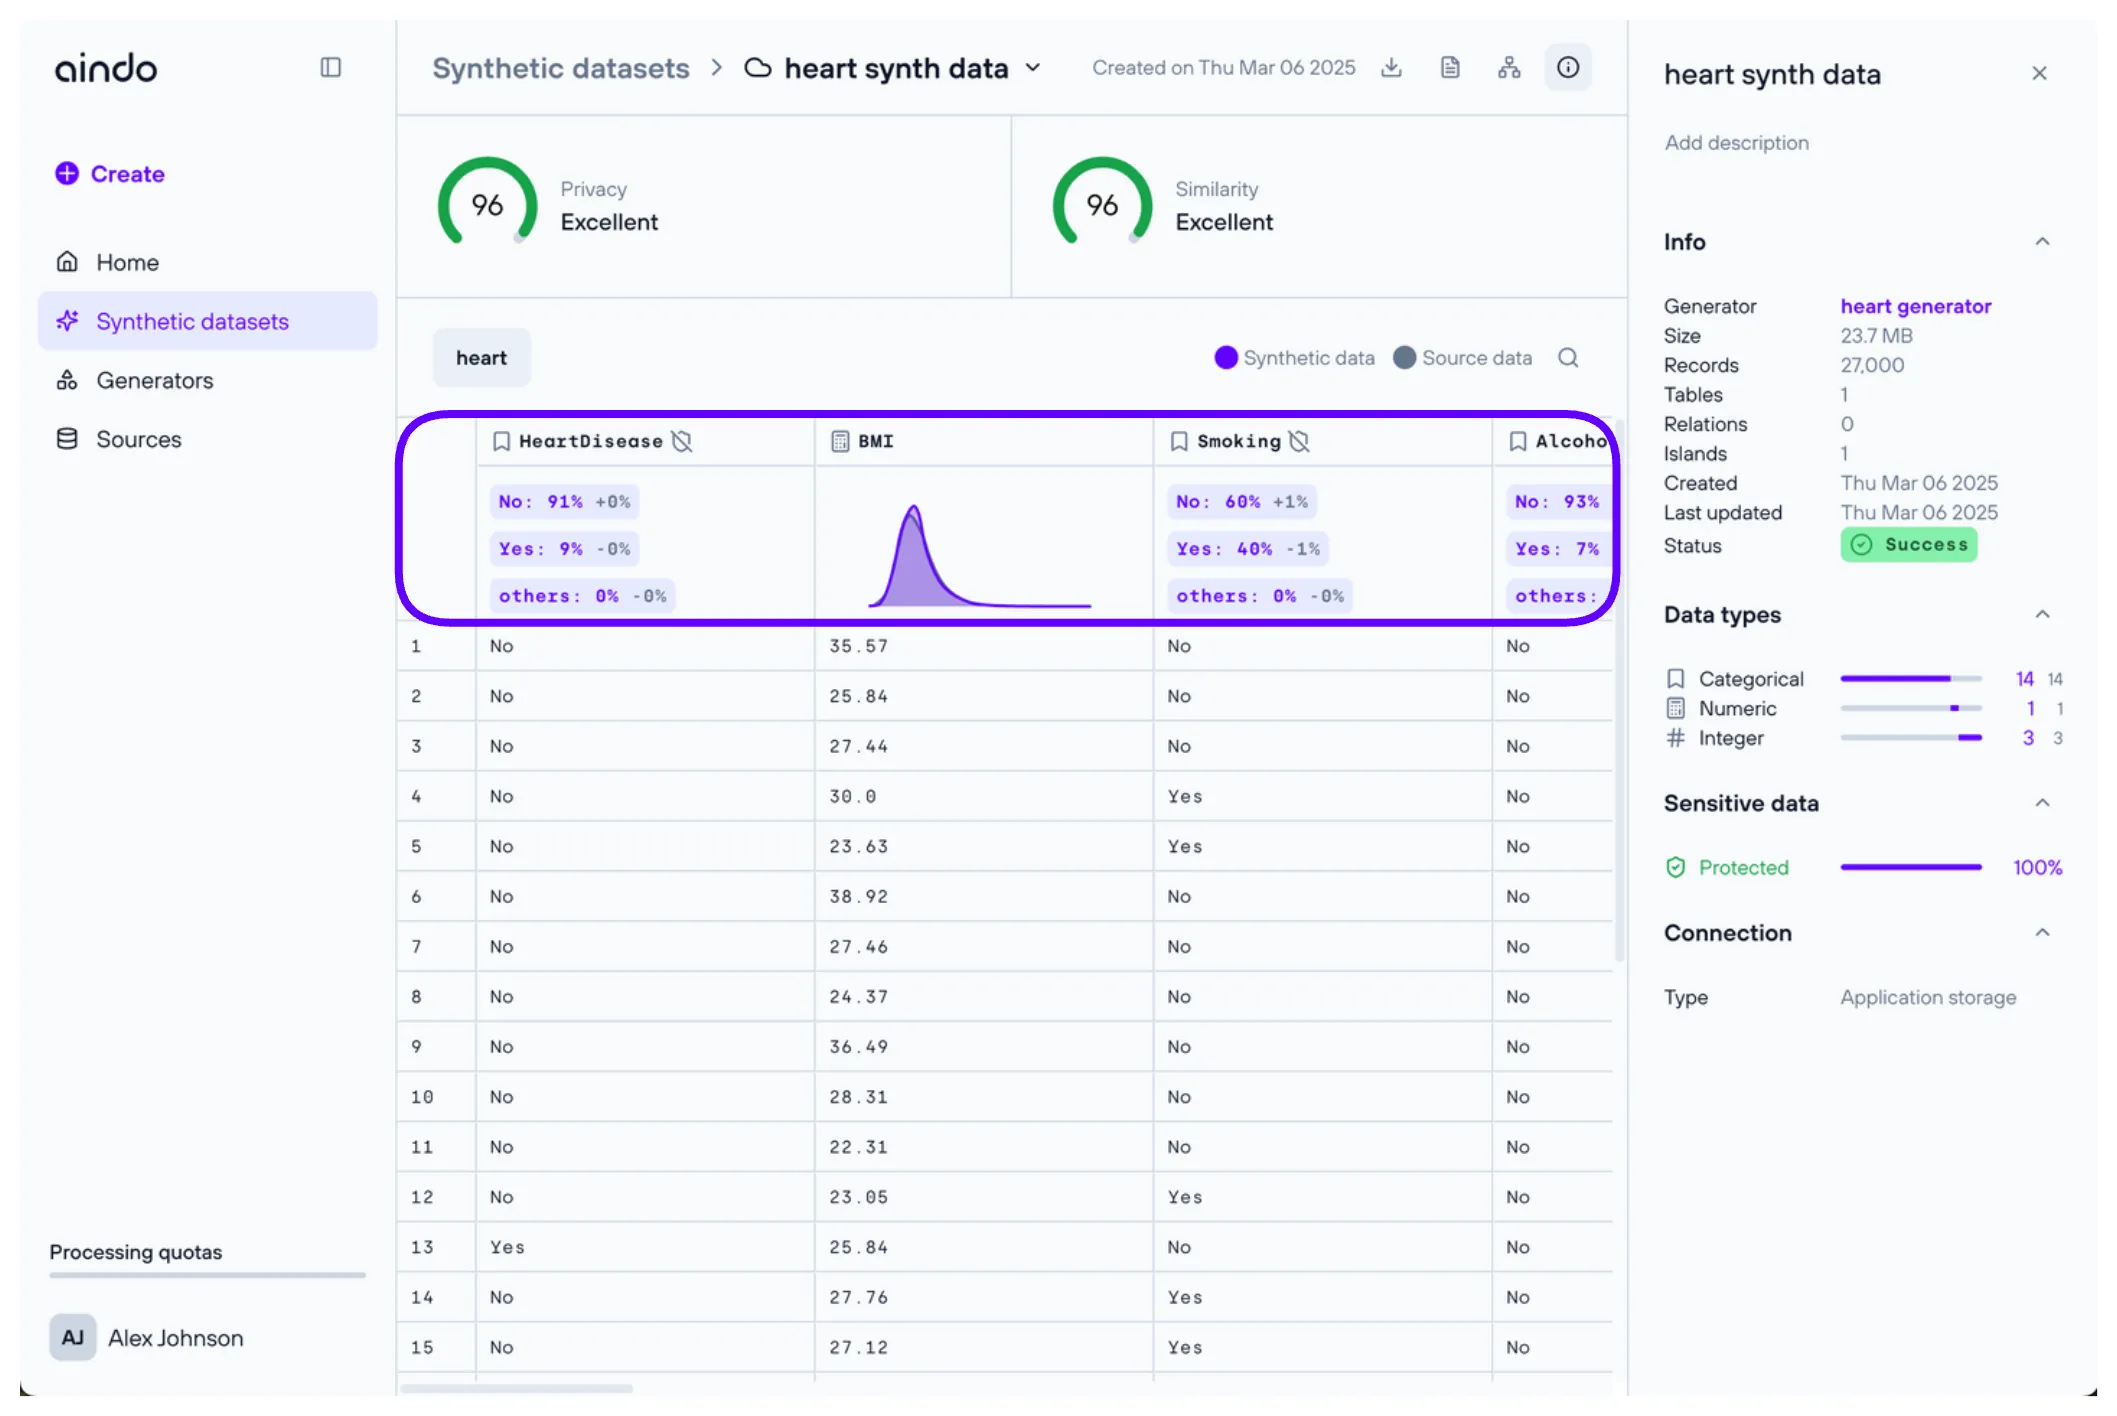
Below these metrics, you will find a preview of the synthesized data, similar to the source view page. Each column header includes an icon representing the column’s data type. If the original column contained sensitive data, a ‘shield’ icon is also displayed.
- A green shield icon indicates that you chose to synthesize the original sensitive data.
- A gray shield icon indicates that you chose not to synthesize the original sensitive data.
Under each column header, a small chart provides key statistics for that column and compares them with the source data.
ReMIA score
Alongside the two metrics above, the platform can compute a ReMIA score, an attack-based privacy metric that estimates whether an attacker could tell that a specific real record was used to train the generator. Unlike the Privacy and Similarity scores, it is not computed automatically with every generation: you start each calculation yourself. See ReMIA score for the methodology and for how to read the value.
When the feature is enabled, a third card appears next to the Privacy and Similarity cards at the top of the view page, showing the most recent calculation for this generated dataset.
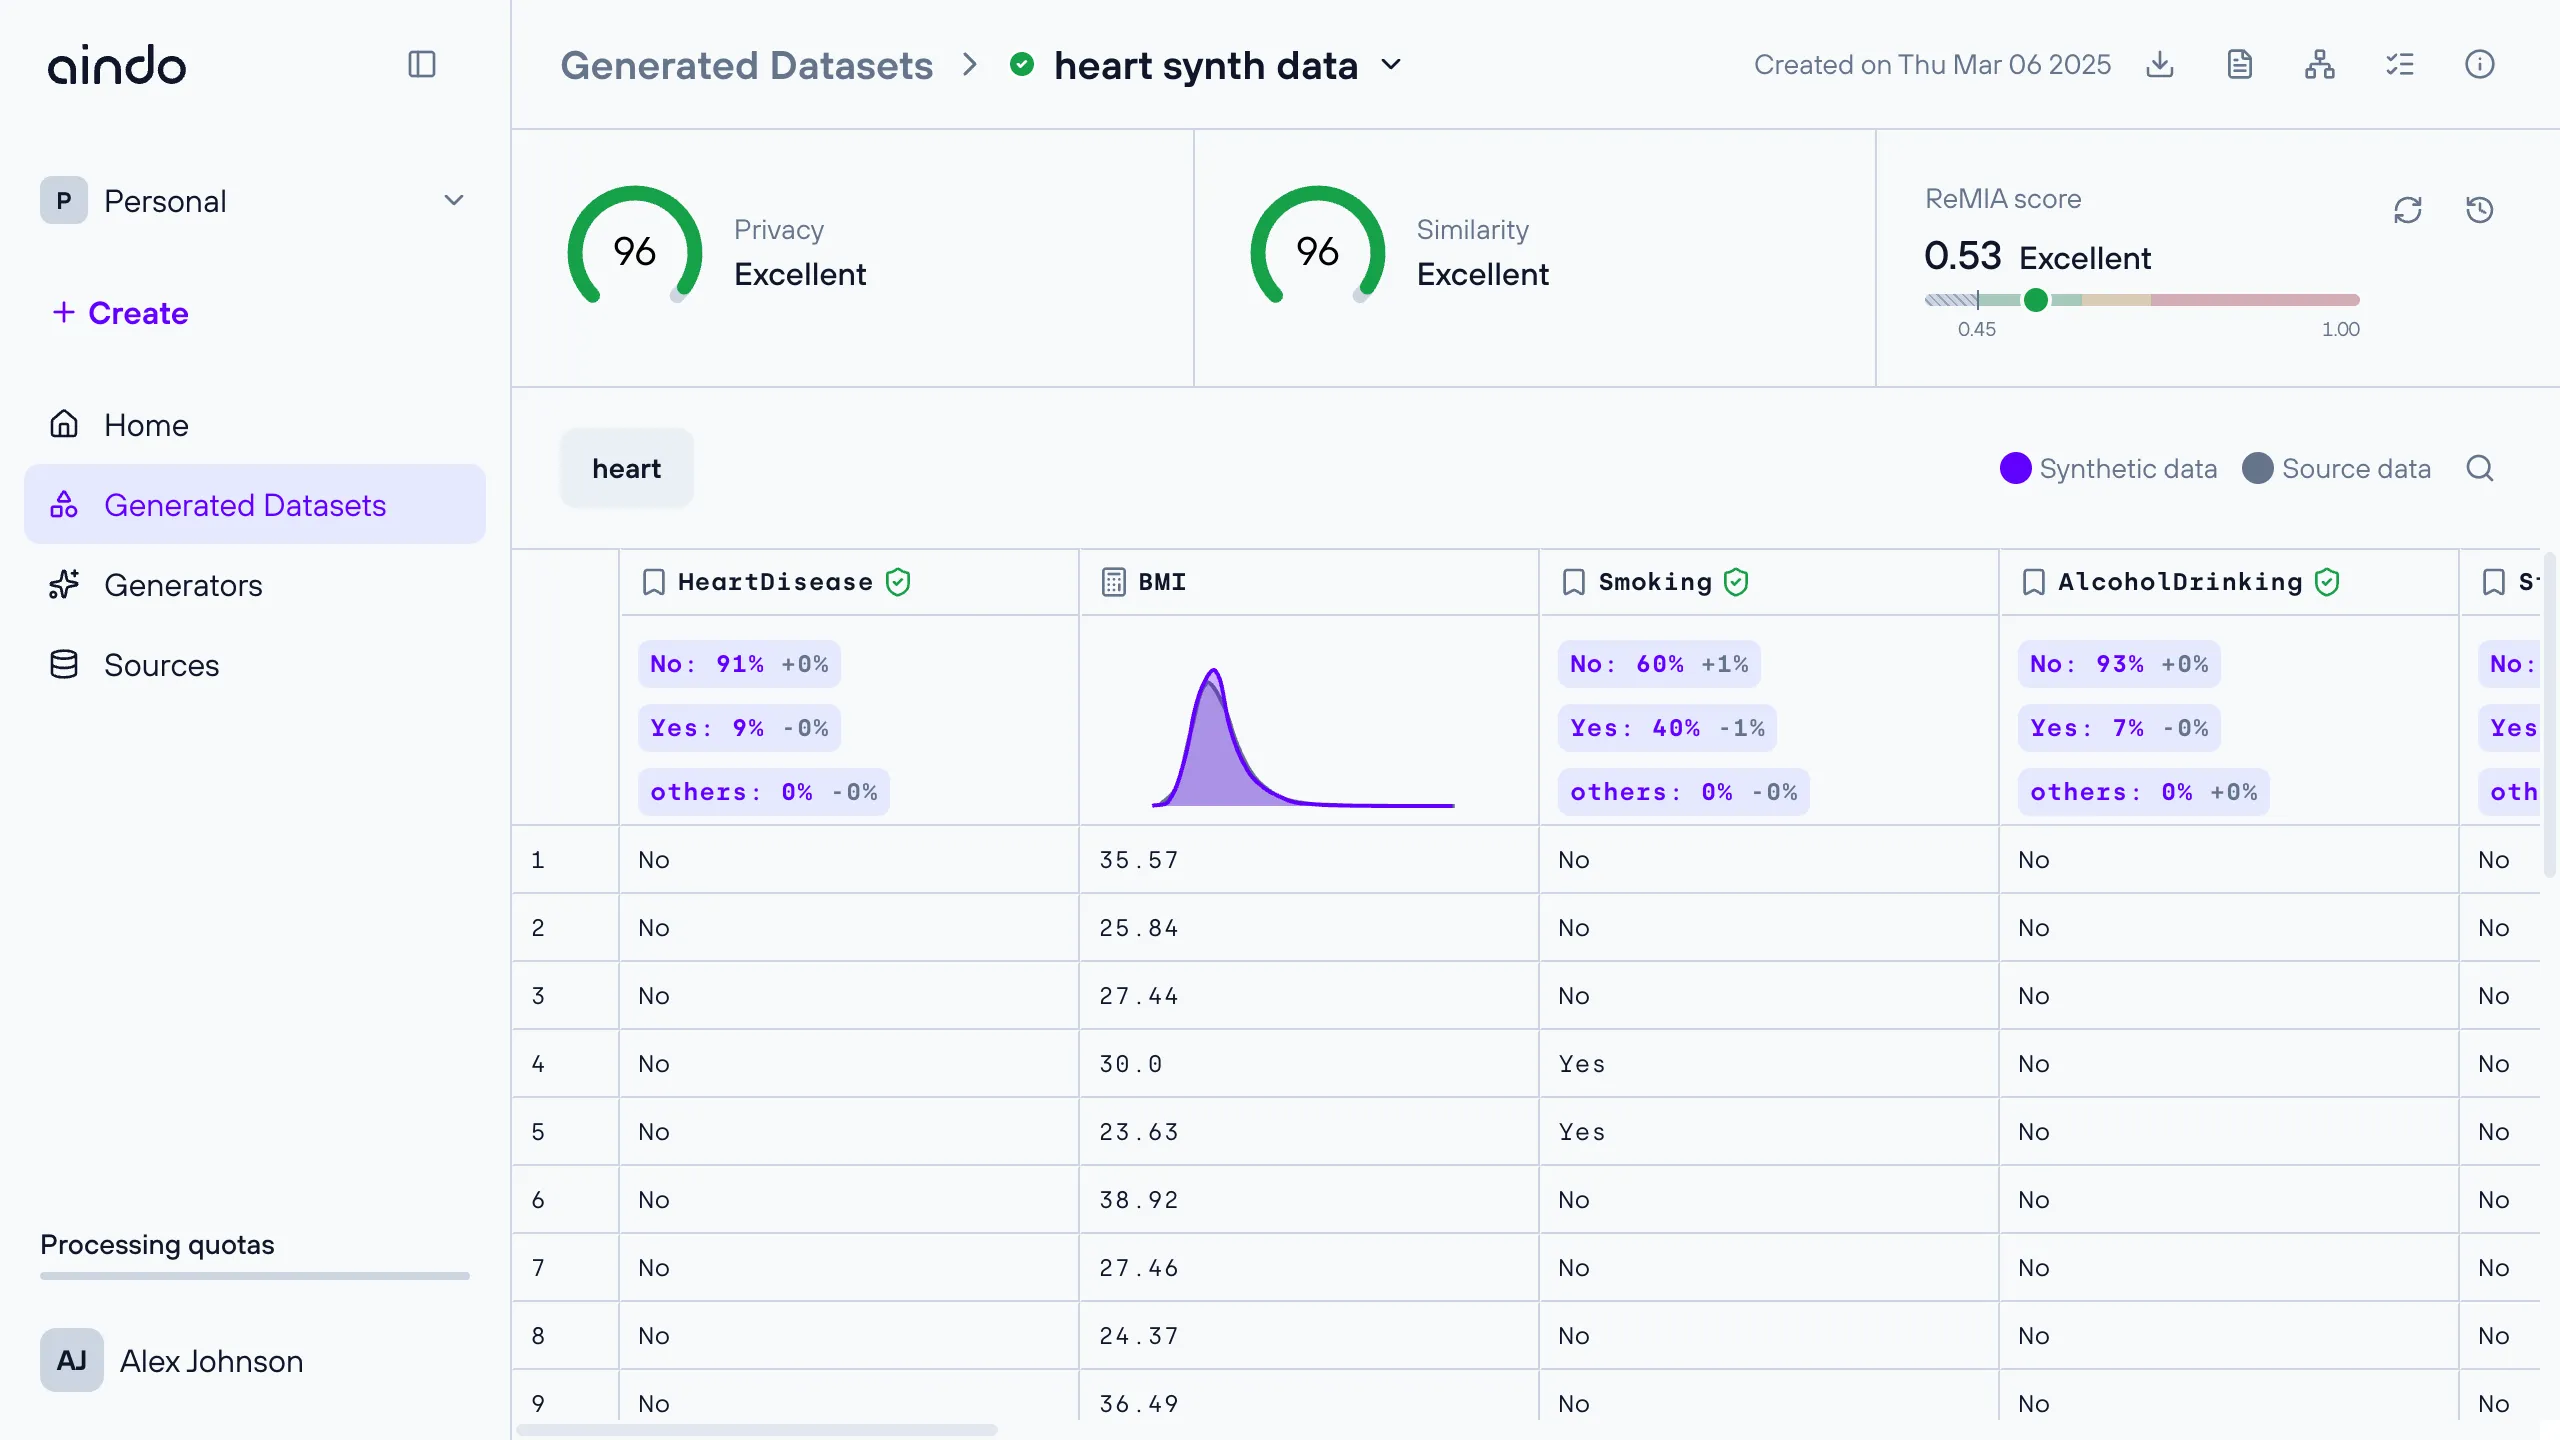
The card shows the score to two decimal places, its rating, and a scale bar marking where the value falls. Hovering
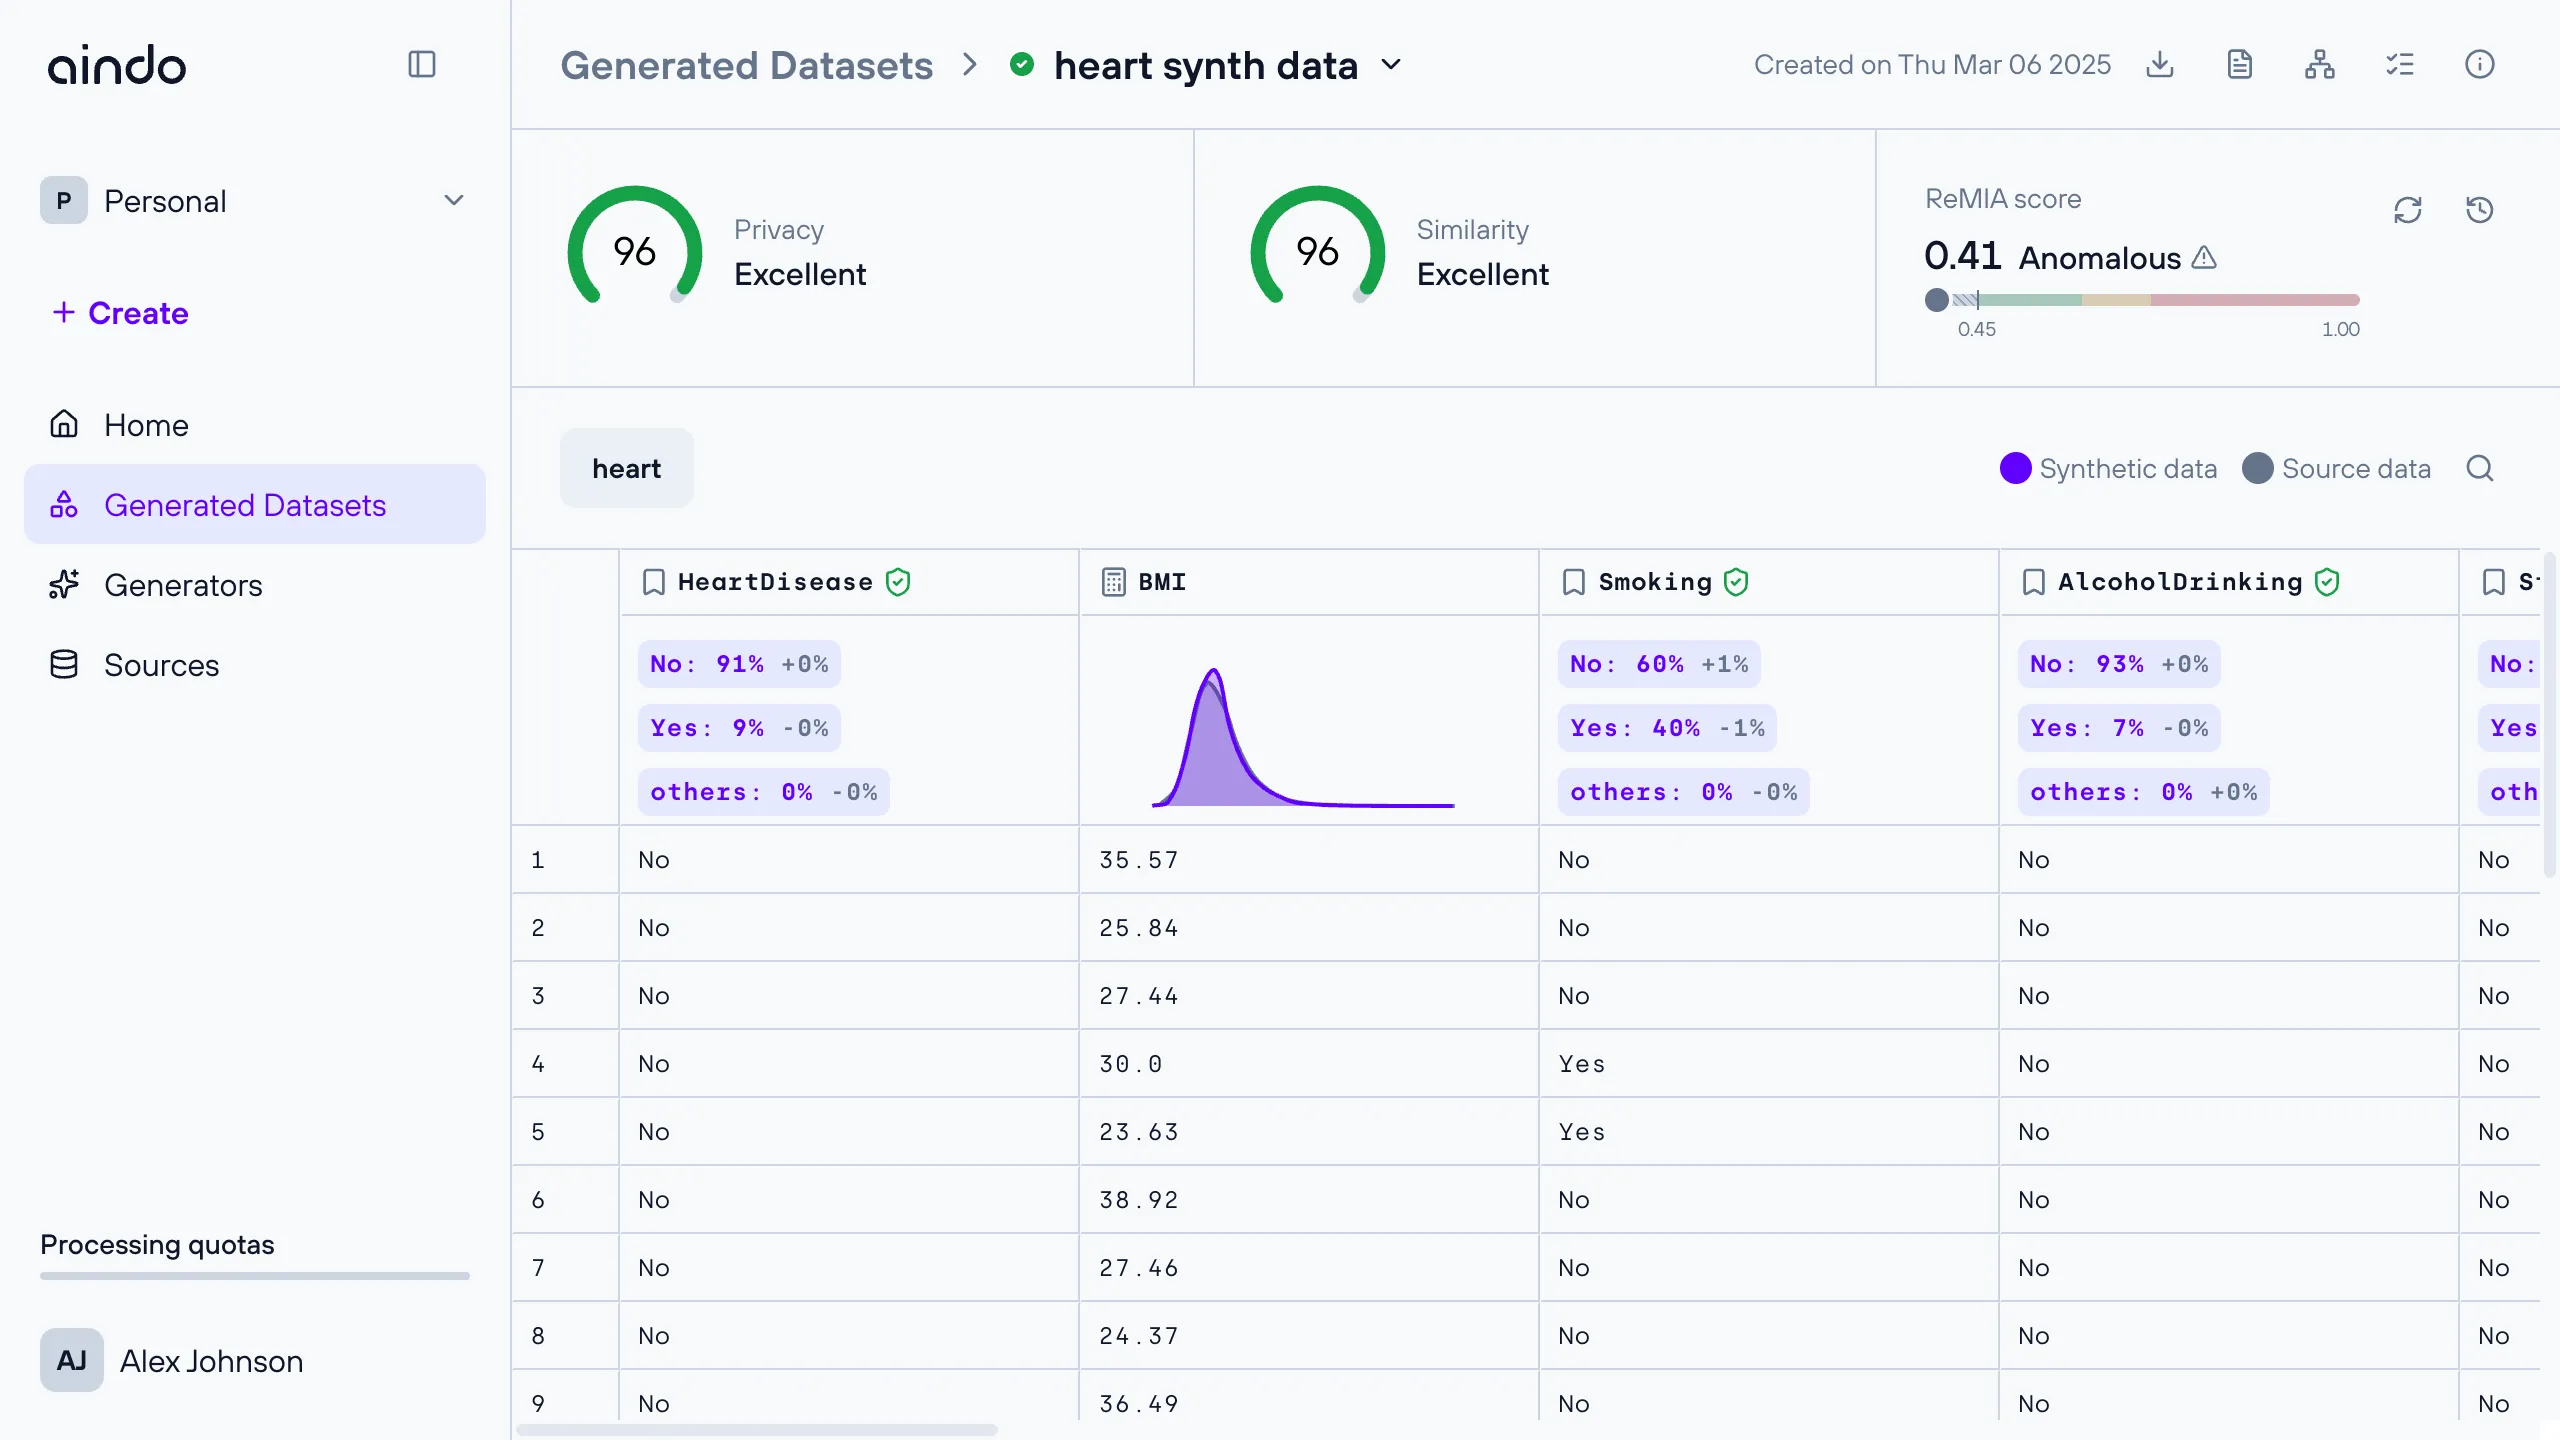
the score shows the standard deviation of the calculation. A score below 0.45 is rated Anomalous and carries a
warning icon explaining that “A score this far below 0.5 indicates performance worse than random, and should not be
trusted.”
If no calculation has ever been run, the card shows Unknown. While one is running, it shows In progress and
updates on its own as the calculation advances.
The same card also appears in the side panel on the list page, with one difference:
there it is omitted entirely until a calculation exists, rather than showing Unknown.
Two buttons sit on the right of the card:
- “Calculate ReMIA score” opens the calculation dialog. While a calculation is already running, this is replaced by “View ReMIA score calculation progress”, which reopens the live progress view.
- “View ReMIA score history” opens the list of past calculations. It stays disabled until at least one calculation exists, explaining “No ReMIA scores have been calculated yet.”
Starting a calculation requires editor access to the generated dataset. Without it the button is disabled and explains “You need editor access to this generated dataset to calculate a new ReMIA score.” If the generator that produced this dataset is no longer available, the button is disabled with “This generator is unavailable, so a new ReMIA score can’t be calculated.”
Calculating a ReMIA score
The “Calculate ReMIA score” dialog collects the settings for the calculation.
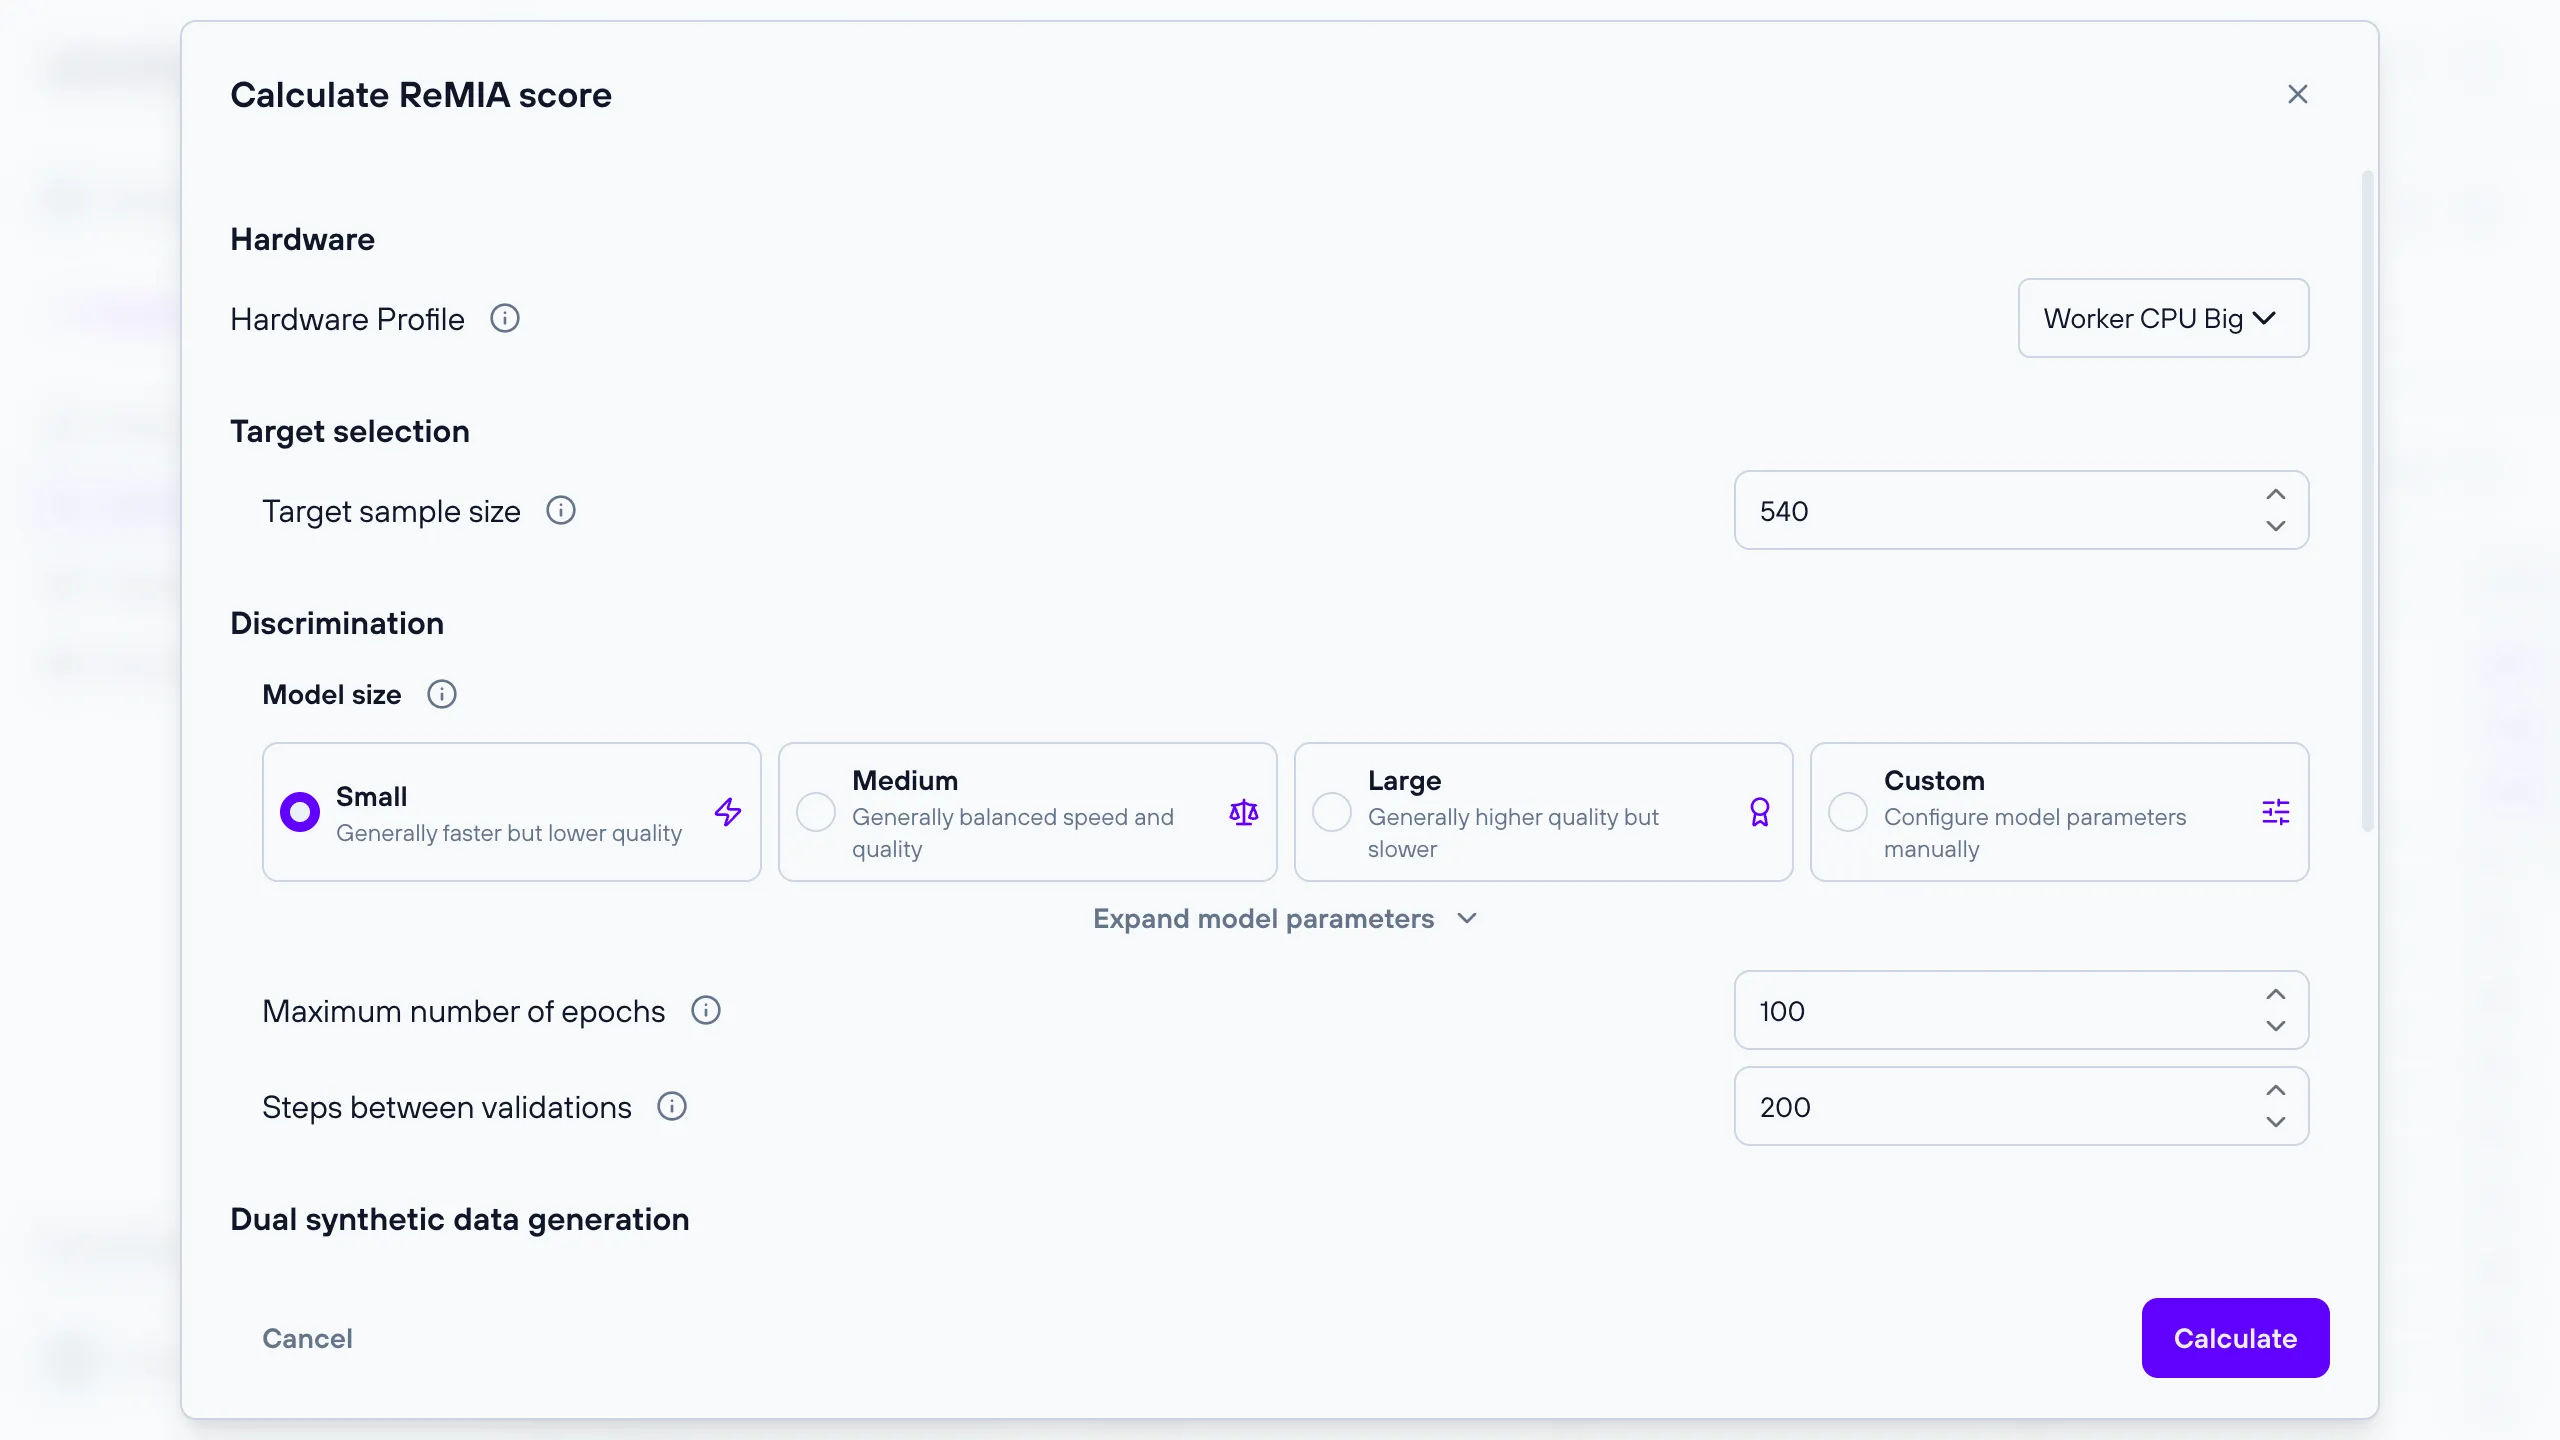
The Hardware section works the same way as the
hardware profile of a generator: if your deployment has profiles
configured, you can pick which one runs the calculation.
The Target selection section holds a single setting:
Target sample size: Number of records in the target set. Each of them is only used for one of the two generations and all of them are included in the computation of the final discrimination score.
The Discrimination section configures the discriminator model that attempts the attack:
Model size: Size of the discriminator model used for scoring. Choose one of theSmall,MediumorLargepresets, orCustomto setNumber of layers,Number of headsandDimensionyourself. “Expand model parameters” reveals the architecture values behind the selected preset.Maximum number of epochs: Maximum number of times the model will see the training dataSteps between validations: Number of steps between each validation check
Below these, the Dual synthetic data generation section shows the settings inherited from the generator that
produced this dataset. These are read-only: the calculation reuses them to reproduce the two generations, so they
cannot be modified here. The main settings are listed directly, and the section’s own “Advanced settings” toggle
expands the rest, followed by the text model settings when the source data has textual columns. If you do not have
access to that generator, the section reads “You don’t have access to view this generator’s configuration.” instead.
The score is genuinely less reliable for these generators. Measuring one faithfully would mean replaying every step of the chain of continuations that produced it, which is not currently supported. The calculation instead trains its two generators from the inherited configuration alone, so what it measures is not quite the generator that produced this dataset.
If the source dataset of the generator has been deleted, starting a calculation fails with “The source dataset for this generator has been deleted, so a new score can’t be calculated.”
Advanced settings
At the bottom of the dialog, a button also labelled “Advanced settings” opens a separate screen giving finer control over the discriminator training. Do not confuse it with the toggle of the same name inside the inherited block above: that one reveals the generator’s settings, this one configures the discriminator. Confirm the screen with “Done” to keep your changes, or leave it with “Back”.
Its parameters are pre-filled with defaults supplied by the platform. A few are deliberately left empty, and what an
empty value means is described per field below. Auto-batching is on by default, which hides Batch size and
Gradient accumulation.
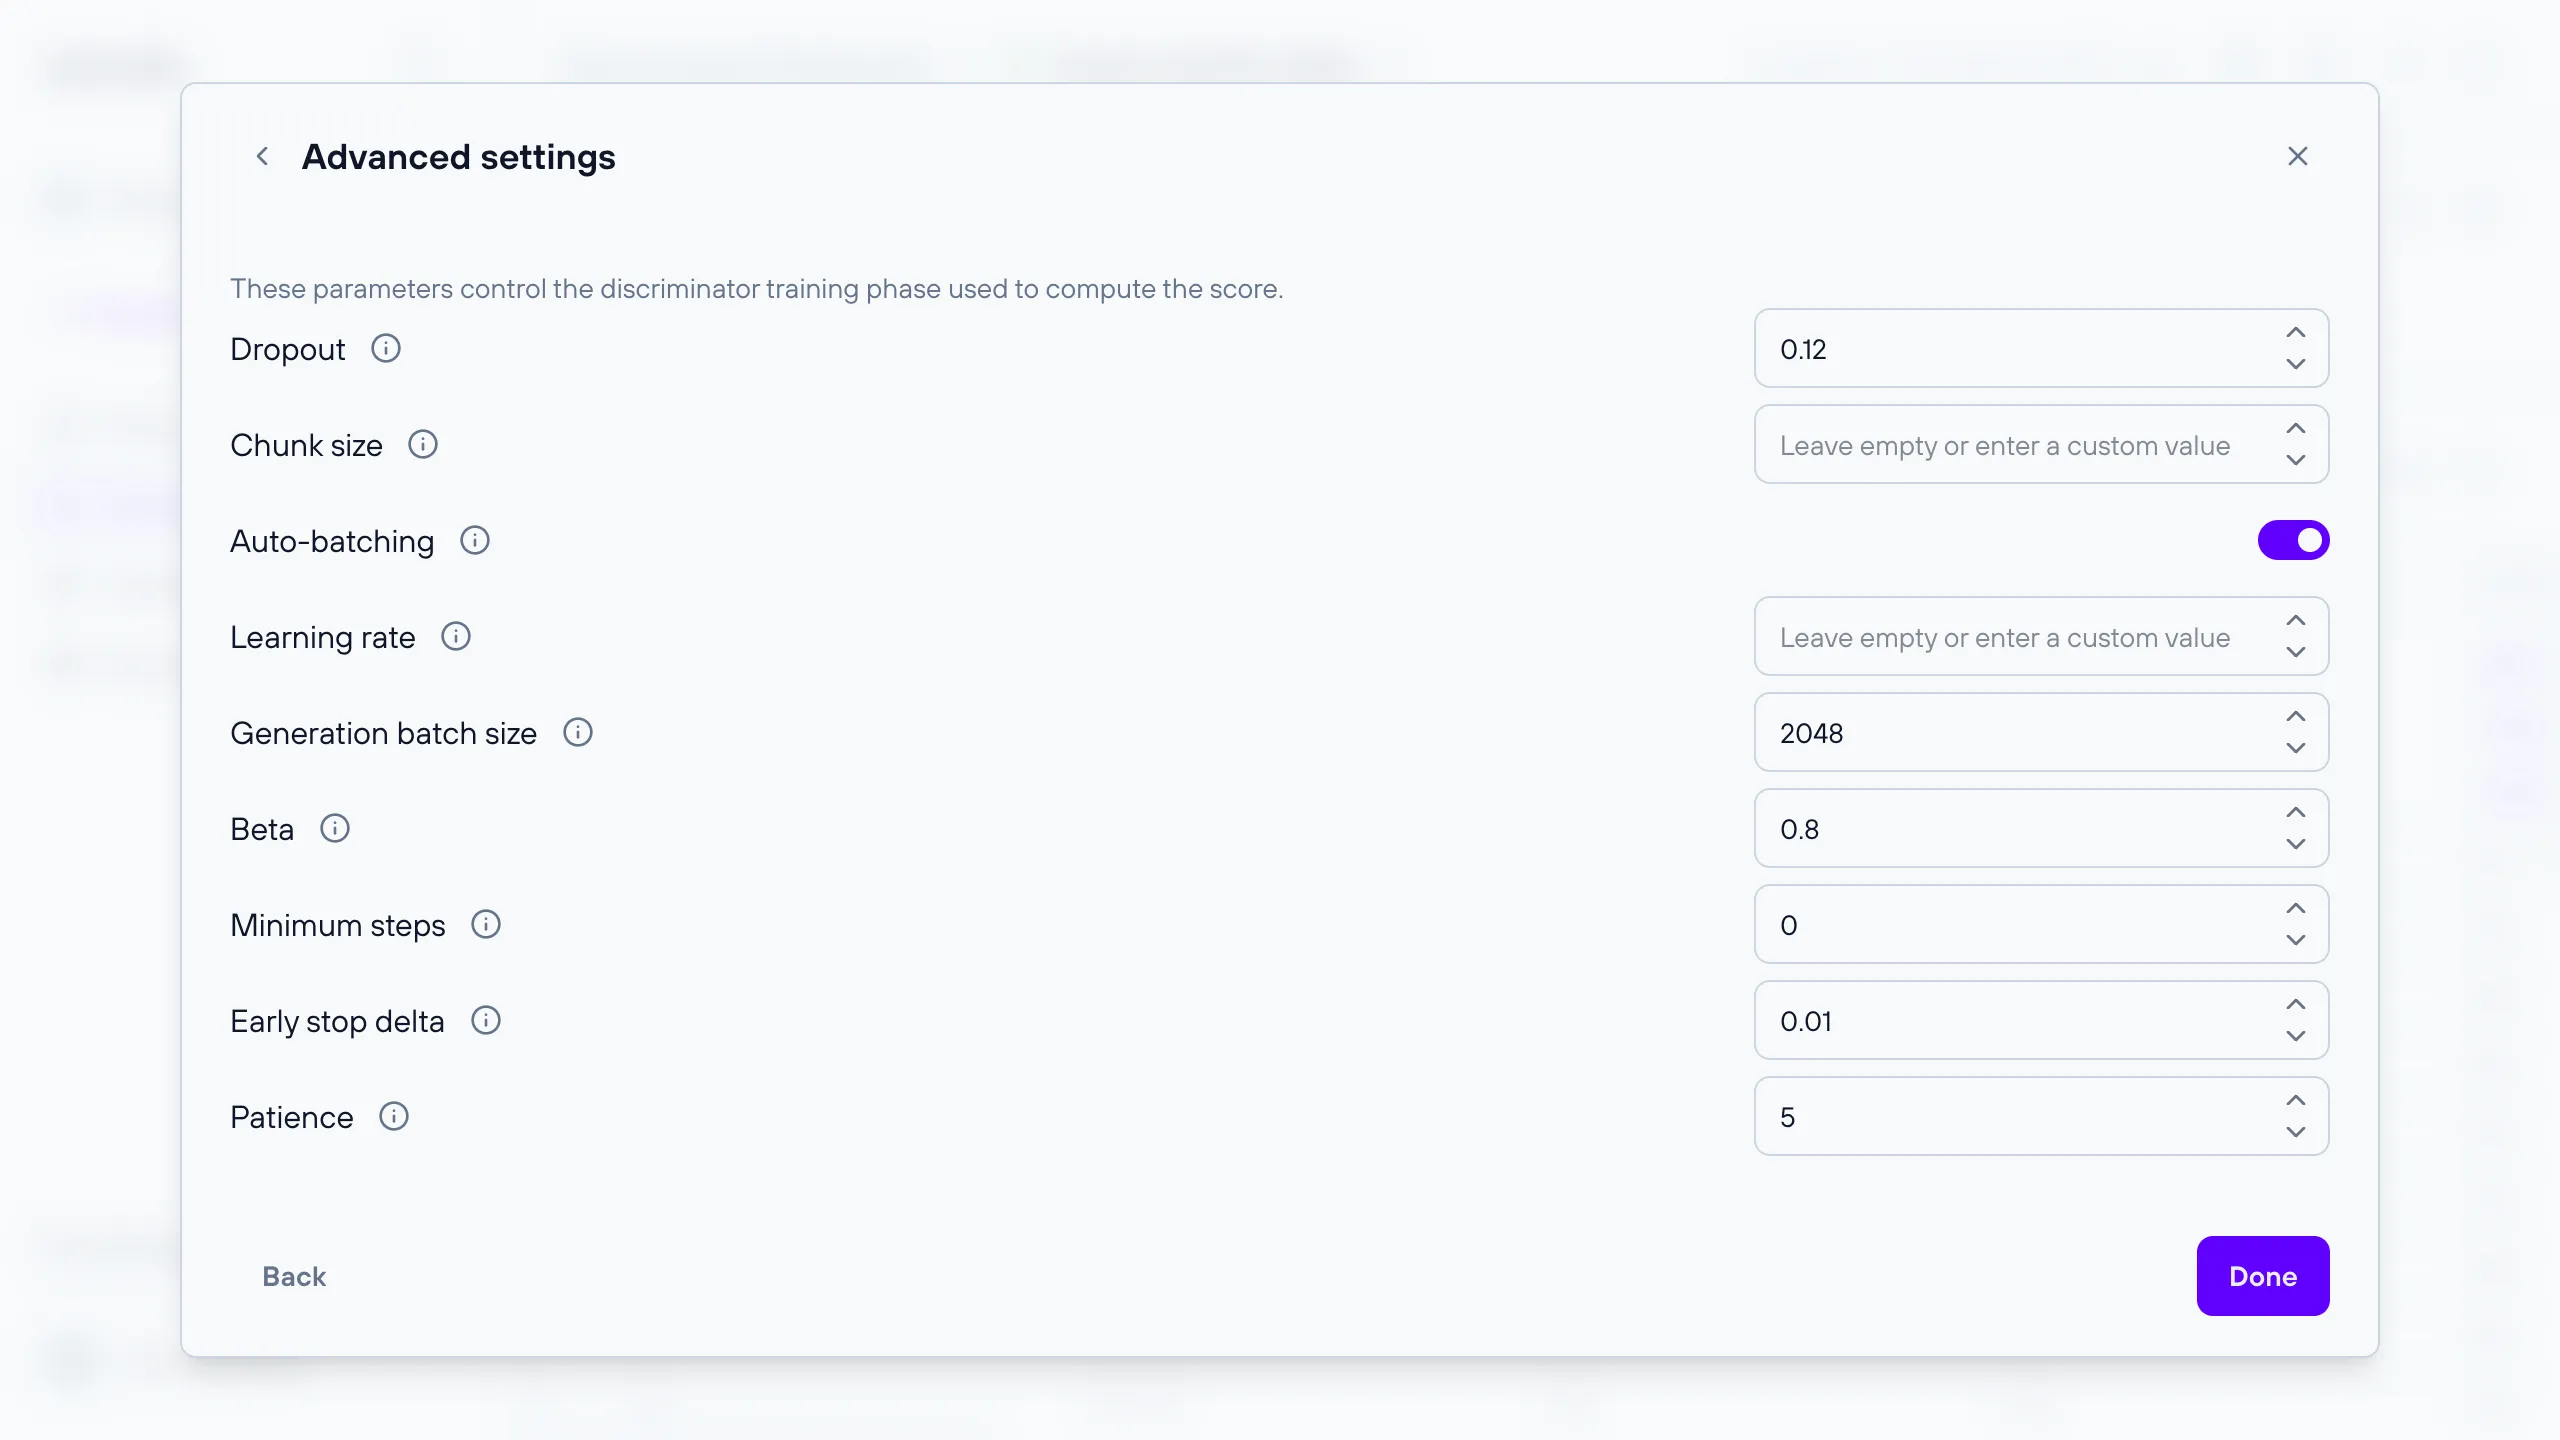
Dropout: Regularization parameter to prevent overfitting (0 to 1). Larger dataset may benefit from a smaller dropout value.Chunk size: When enabled, the dataset is preprocessed in chunks of the specified size. Smaller chunk sizes reduce memory usage, but may increase overall processing time. If left blank, the dataset is not processed in chunks.Auto-batching: The batch size is the number of samples processed in parallel during training. If auto-batching is enabled, its value will be determined automatically based on the available memory.Batch size: Number of samples processed at each training step. This parameter is available only whenAuto-batchingis disabledLearning rate: Learning rate used for optimization. If left blank, the value will be estimated automatically.Gradient accumulation: This parameter determines the number of batches processed before an optimization step. In practice, the logical batch size will be gradient accumulation * batch size. Use this parameter if the memory available does not allow you to use a batch size large enough for your use case. This parameter is available only whenAuto-batchingis disabledGeneration batch size: Number of records that are synthesized in parallelBeta: Smoothing factor for the exponential moving average applied to the AUC-ROC and accuracy of both the target and the control set during discriminator training.Minimum steps: Minimum number of training steps before early stopping is allowed.Early stop delta: Minimum change in the smoothed control AUC-ROC to account as improvement.Patience: Number of validation steps to wait for improvement before stopping.
Click “Calculate” to start the calculation. The dialog then switches to the progress view described below.
Following a calculation
A ReMIA calculation retrains the generative model twice and then trains a discriminator, so it can take a while. The “ReMIA score calculation” dialog shows a live view of its progress, broken into four stages:
Data loadingGeneration (1/2)Generation (2/2)Discriminator training
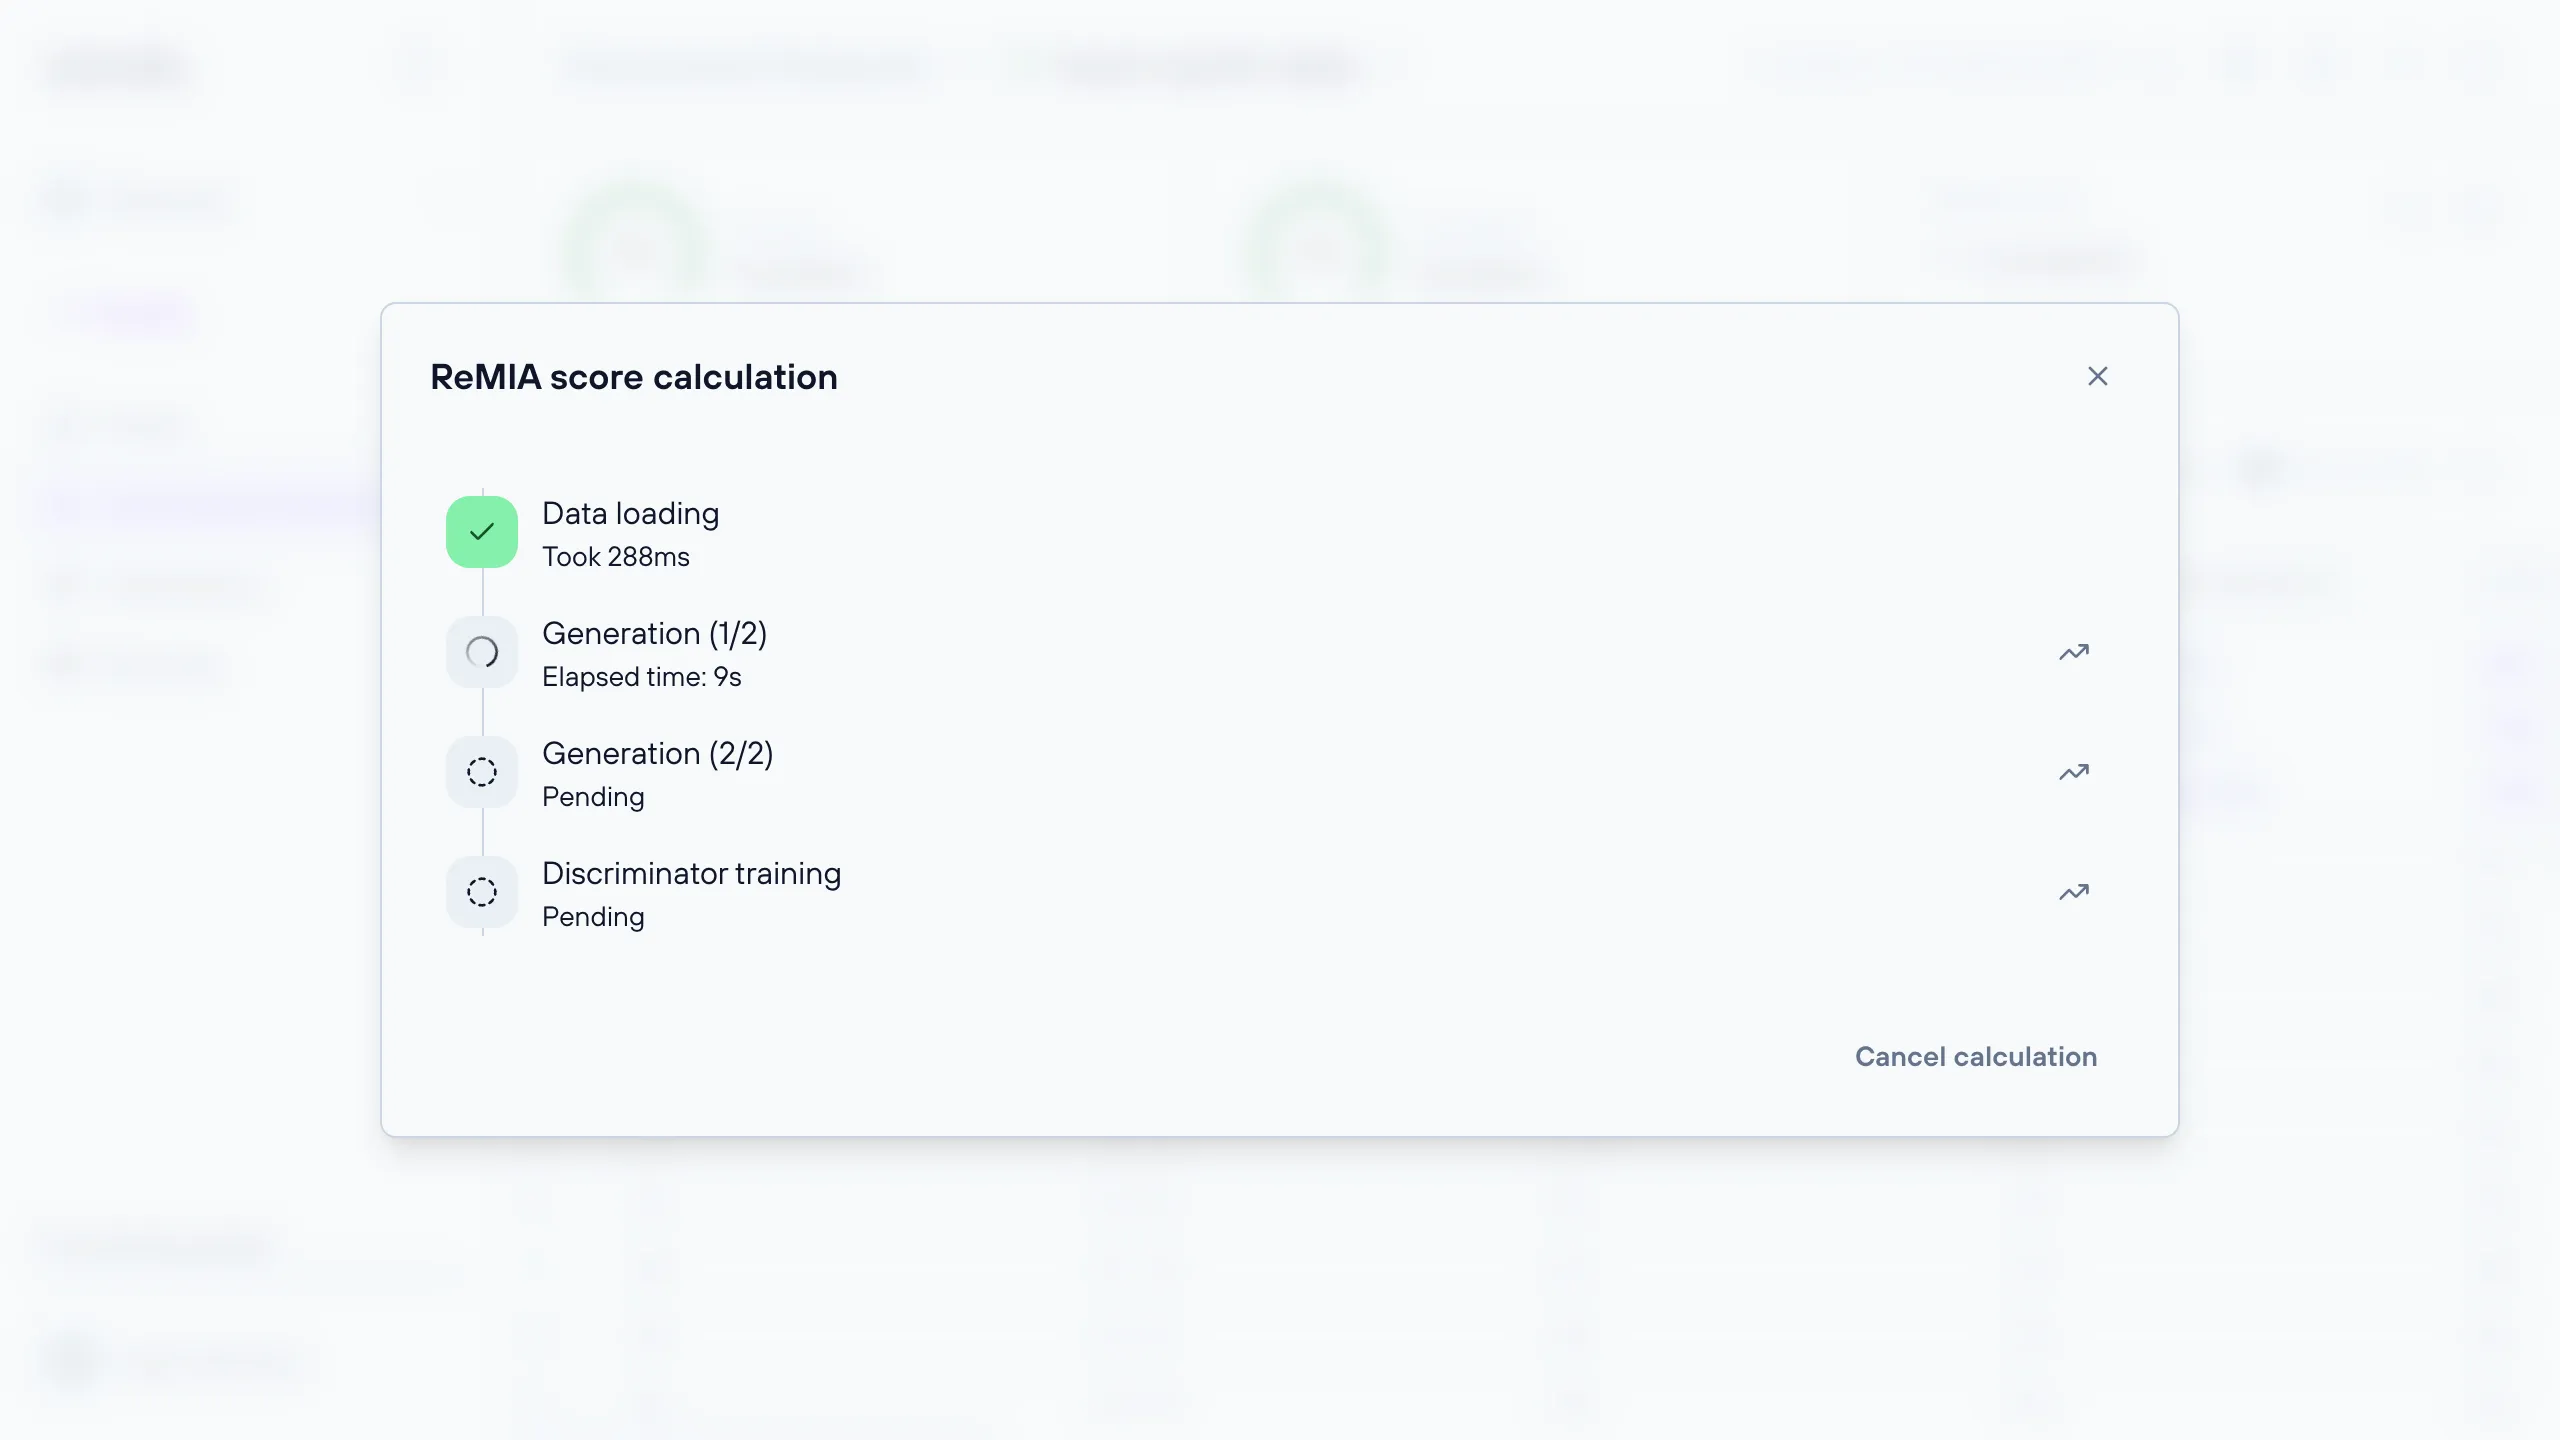
Each stage reports its state using the same vocabulary as the Generation Stages dialog:
Pending before it starts, Elapsed time: <duration> while it is running, Took <duration> once it has finished,
and Aborted or Error if it did not complete successfully.
Every stage except Data loading carries a chart toggle at the right of its row, collapsed by default. Expanding a
generation stage plots its Validation loss against the training Step. Expanding the discriminator stage plots
Target AUC-ROC and Control AUC-ROC against the training Step, each on its own y-axis, so the two lines cannot be
compared by height alone.
Only the target series carries a shaded band for its standard deviation; hovering a point reports the deviation for
both. The control series is the reference for how the discriminator behaves when there is no membership signal to
find.
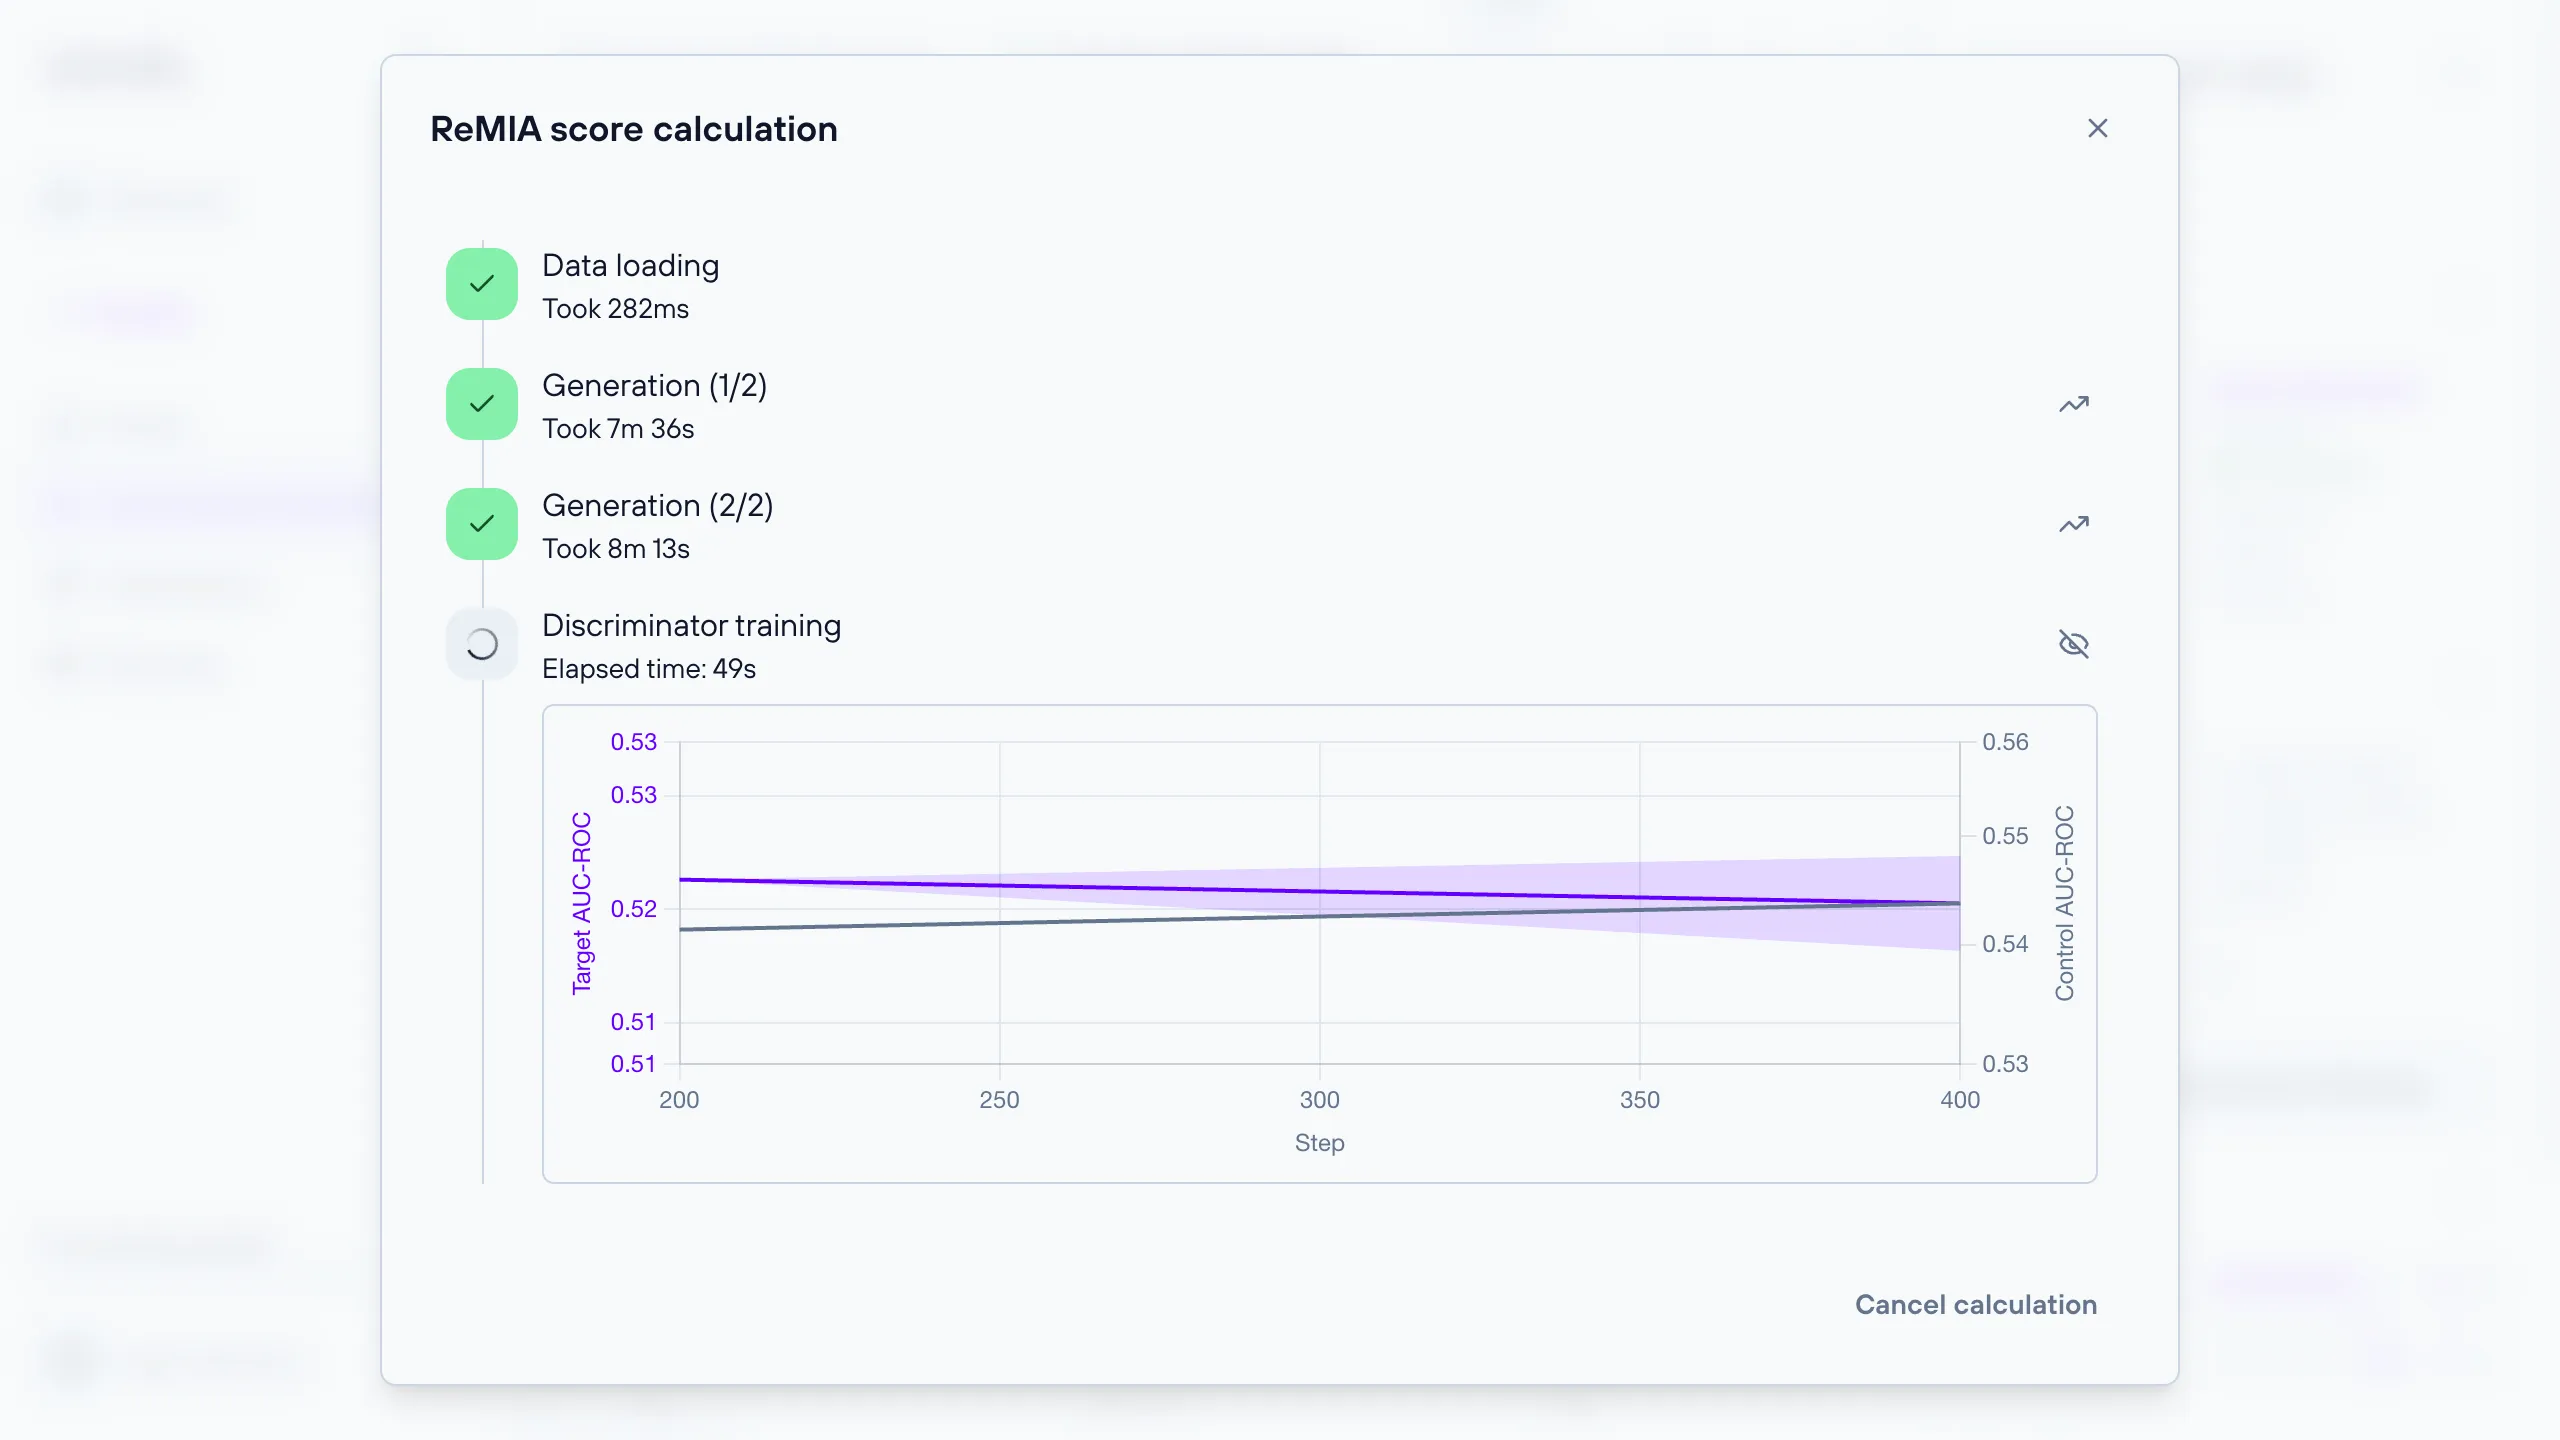
You can close the dialog and come back later: the calculation continues in the background, and the “View ReMIA score calculation progress” button on the card reopens this view.
To stop a calculation, click “Cancel calculation”. A confirmation dialog warns that “This will abort the ReMIA score calculation. No score will be produced.”
Calculation history
The “View ReMIA score history” button on the card opens the “ReMIA score history” dialog, listing every calculation run for this generated dataset with the date it was calculated, its status and its score.
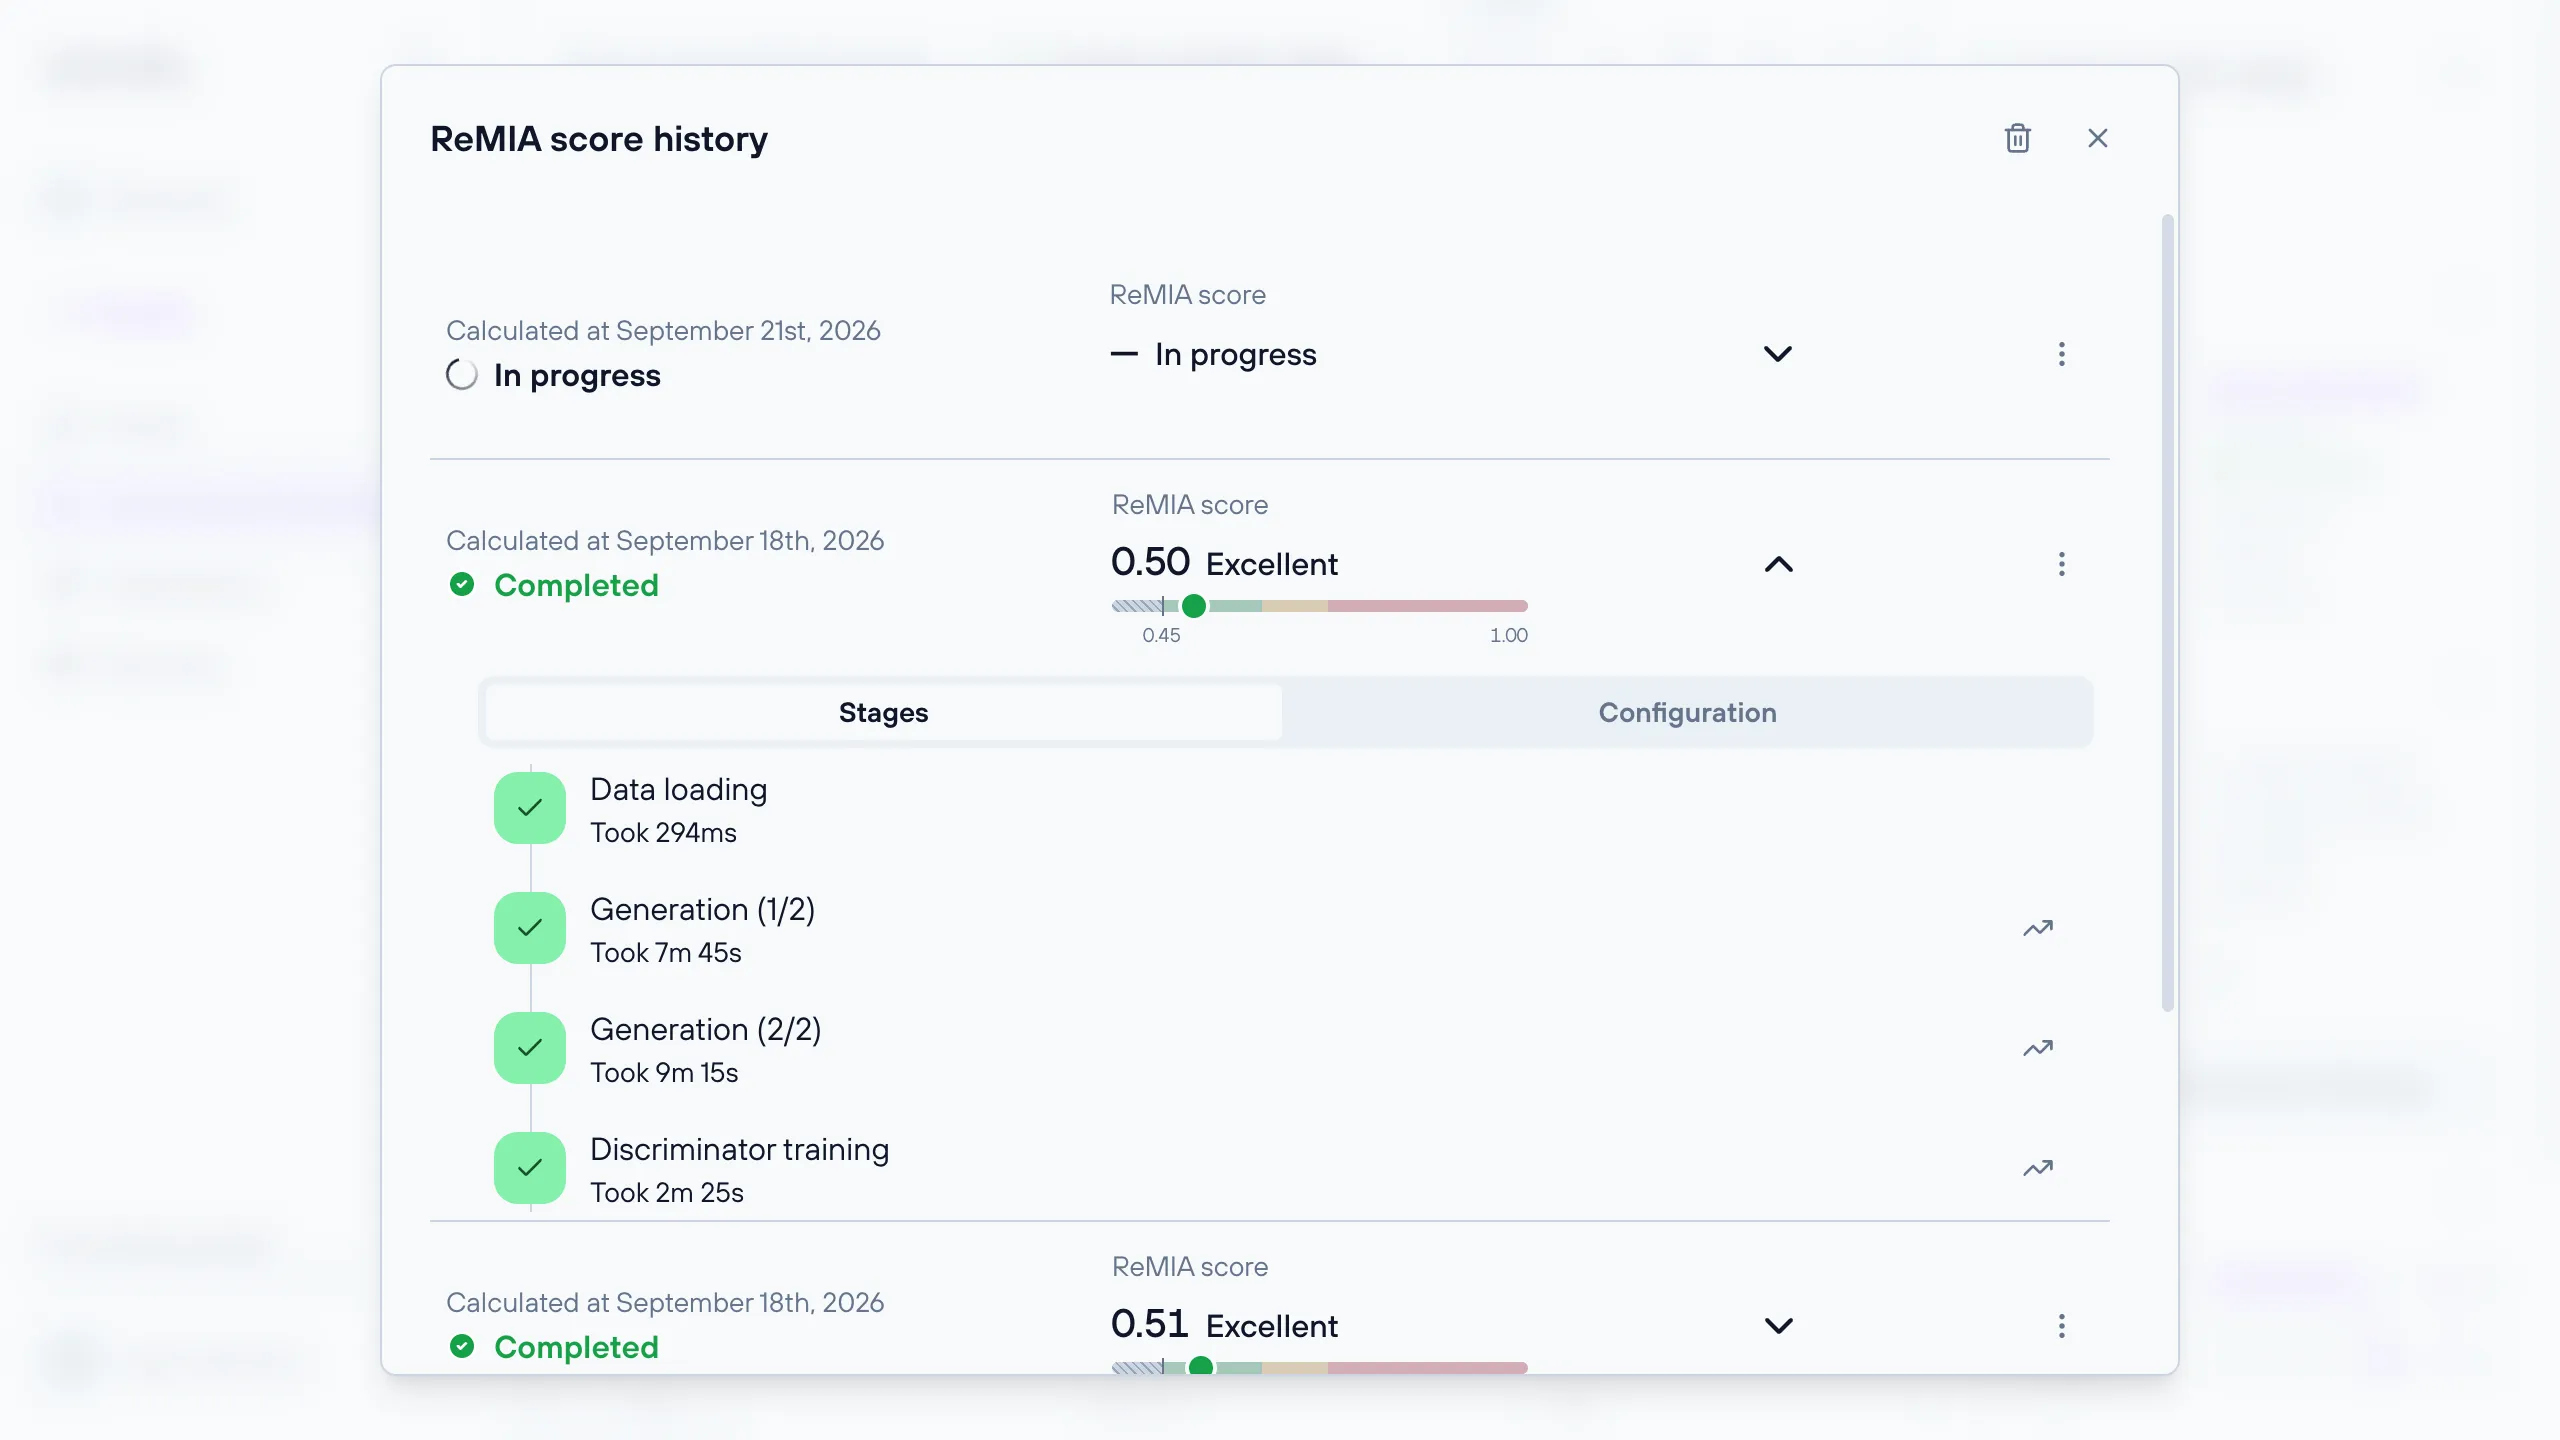
A calculation can be in one of five states: Pending, In progress, Completed, Failed or Cancelled.
Click a row to expand it. While a calculation is still running, the expanded row shows the same live stage view described above. Once it has ended, two tabs appear:
- “Stages” keeps the stage timeline and its charts available, so a finished calculation can still be inspected.
- “Configuration” shows the settings that calculation was run with, including its hardware profile.
If you have permission to delete this generated dataset, each row carries a menu offering “Move to trash”, and a trash icon appears in the dialog header. A calculation that is still running cannot be deleted; cancel it first, as the menu explains with “Cancel the calculation before deleting it”.
A toast confirms the move and offers “UNDO” to reverse it straight away. After deletion, the calculation is not permanently removed immediately. It moves to the trash, which you reach with the trash icon in the dialog header, where it can be restored. The dialog title then reads “Deleted ReMIA calculations”. Rows cannot be expanded in the trash: a deleted calculation’s stages and configuration are not viewable while it is there. Restoring it makes them available again.
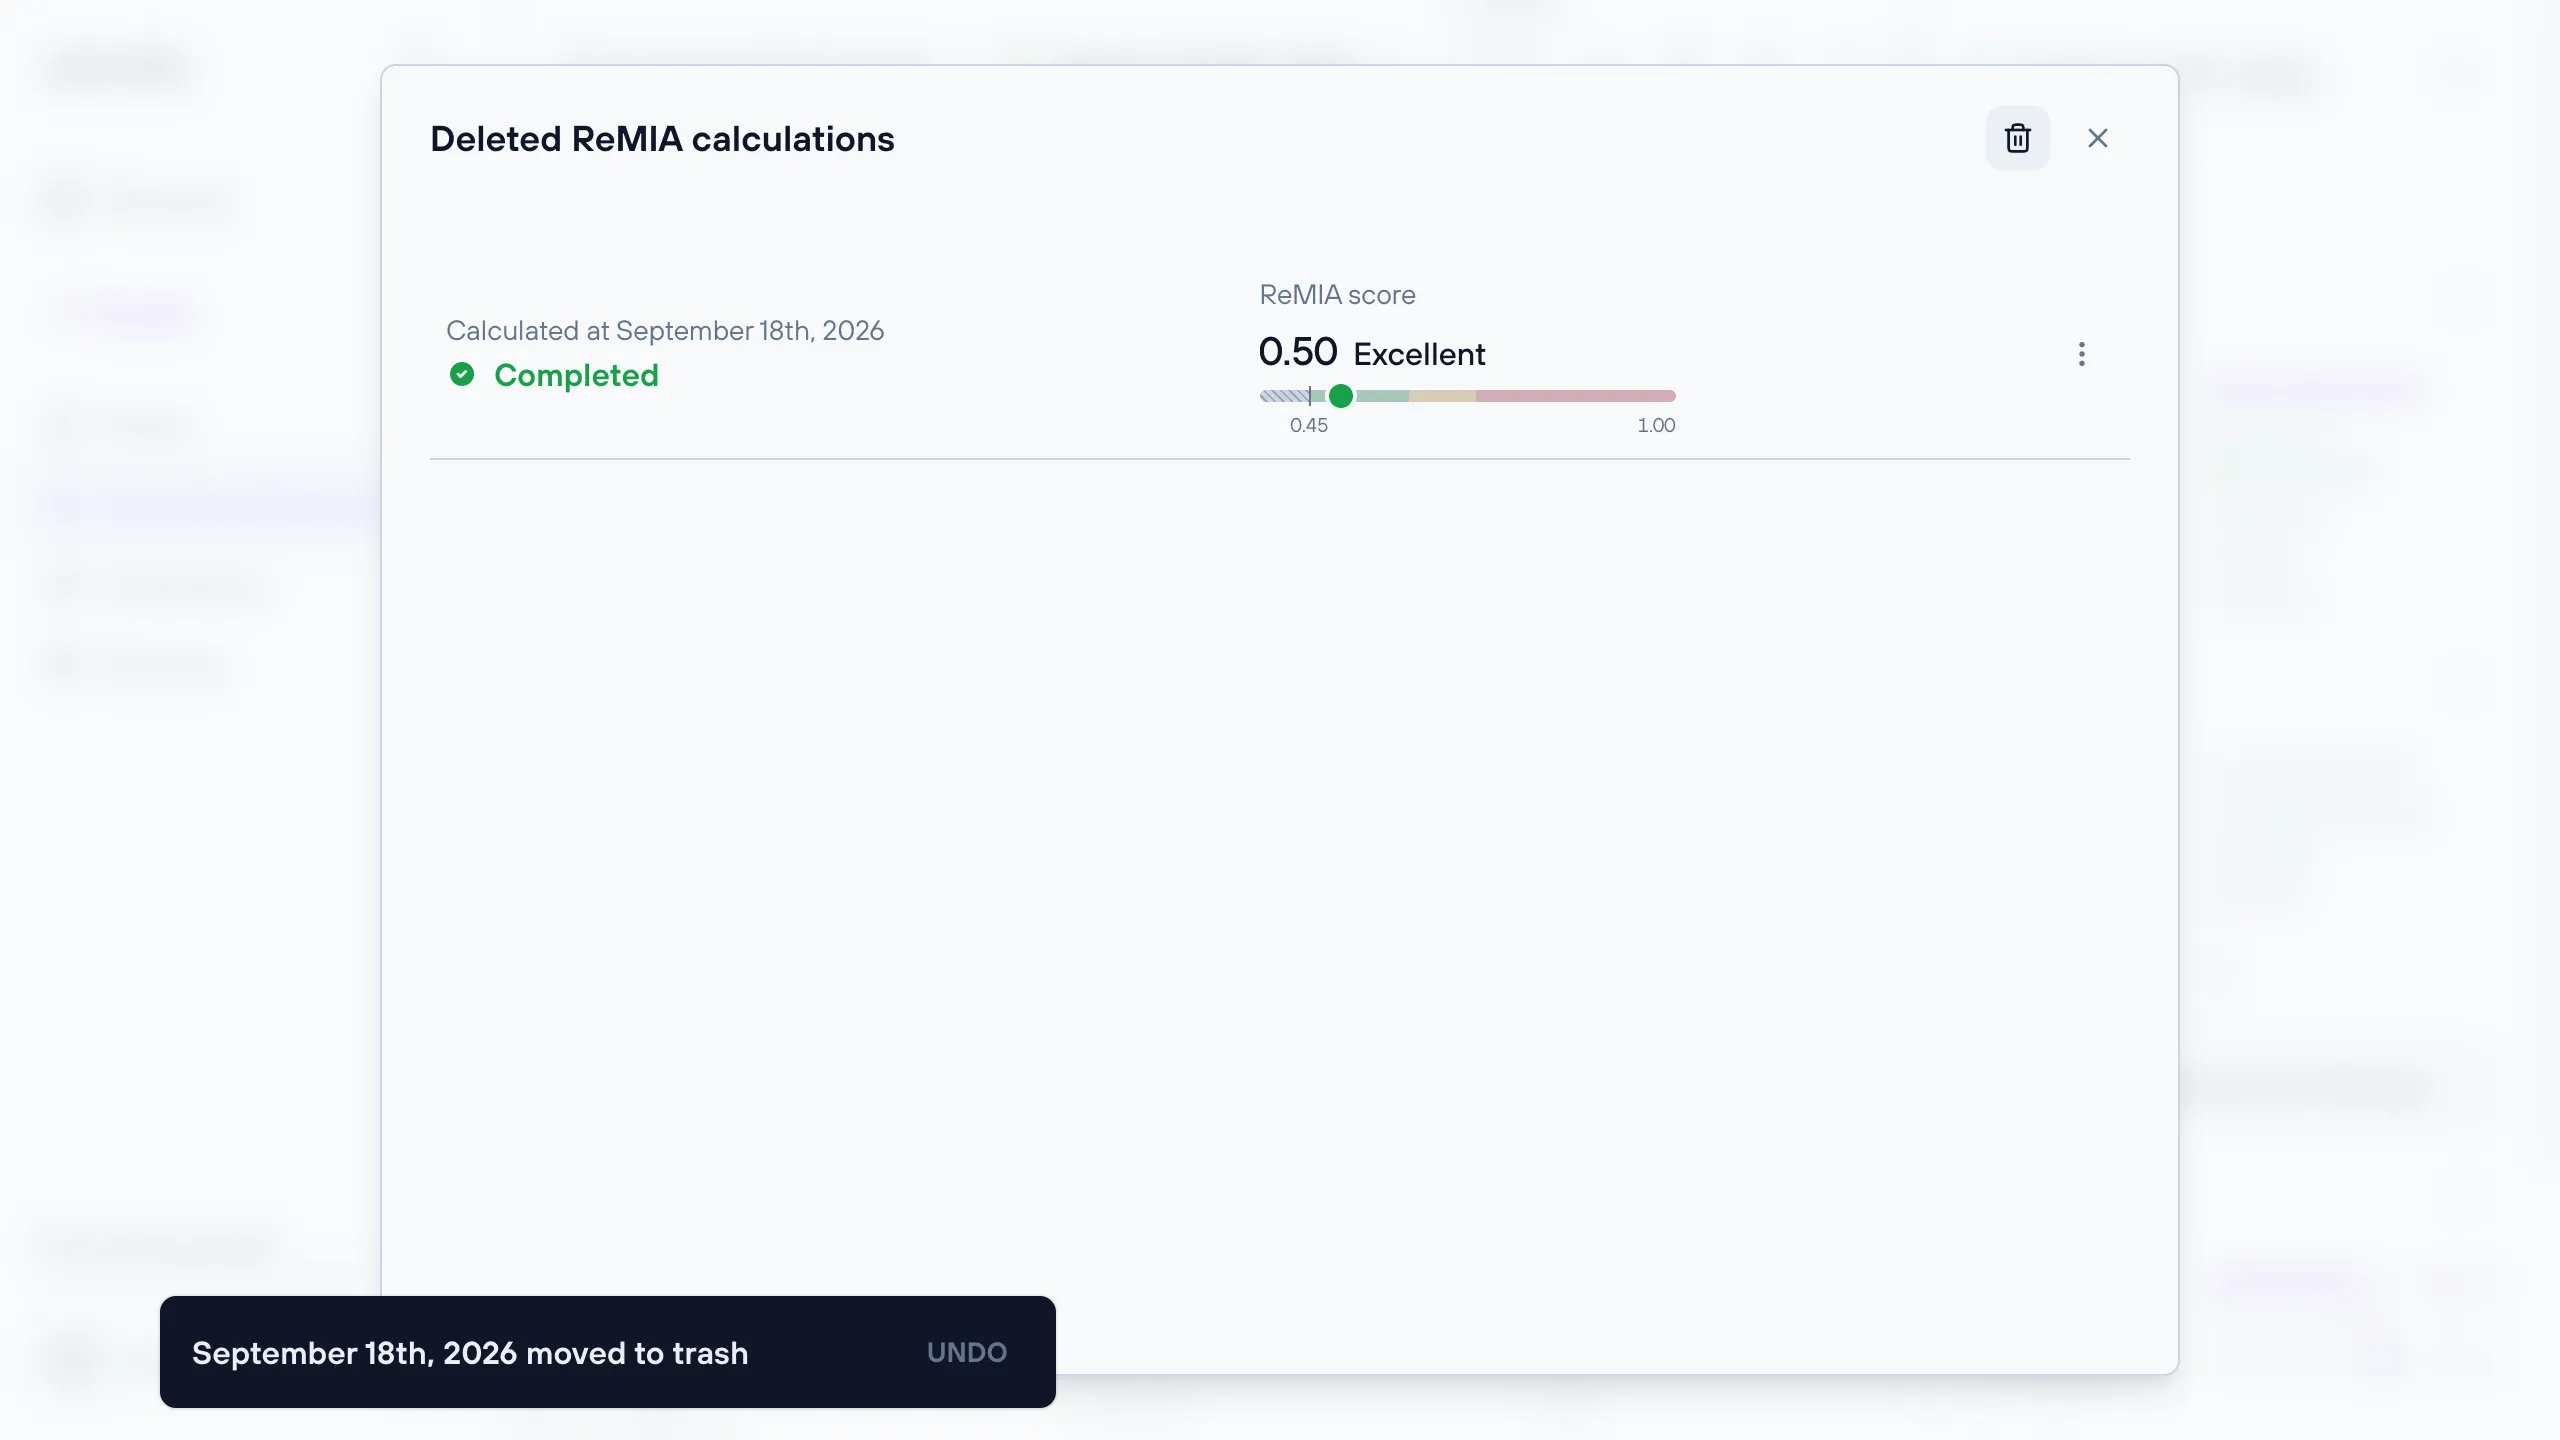
From the trash, each calculation’s menu offers “Restore” to bring it back, or “Delete forever” to remove it for good. Deleting forever asks for confirmation, warning that “This action will permanently delete this ReMIA calculation and its results, and it cannot be undone.”
Report
The report is a PDF containing detailed statistics to thoroughly compare the synthetic data with the original dataset. It helps evaluate the quality of the synthetic data.
To download the report, click the “Report” icon in the top right corner of the page.

Quick synthesis details
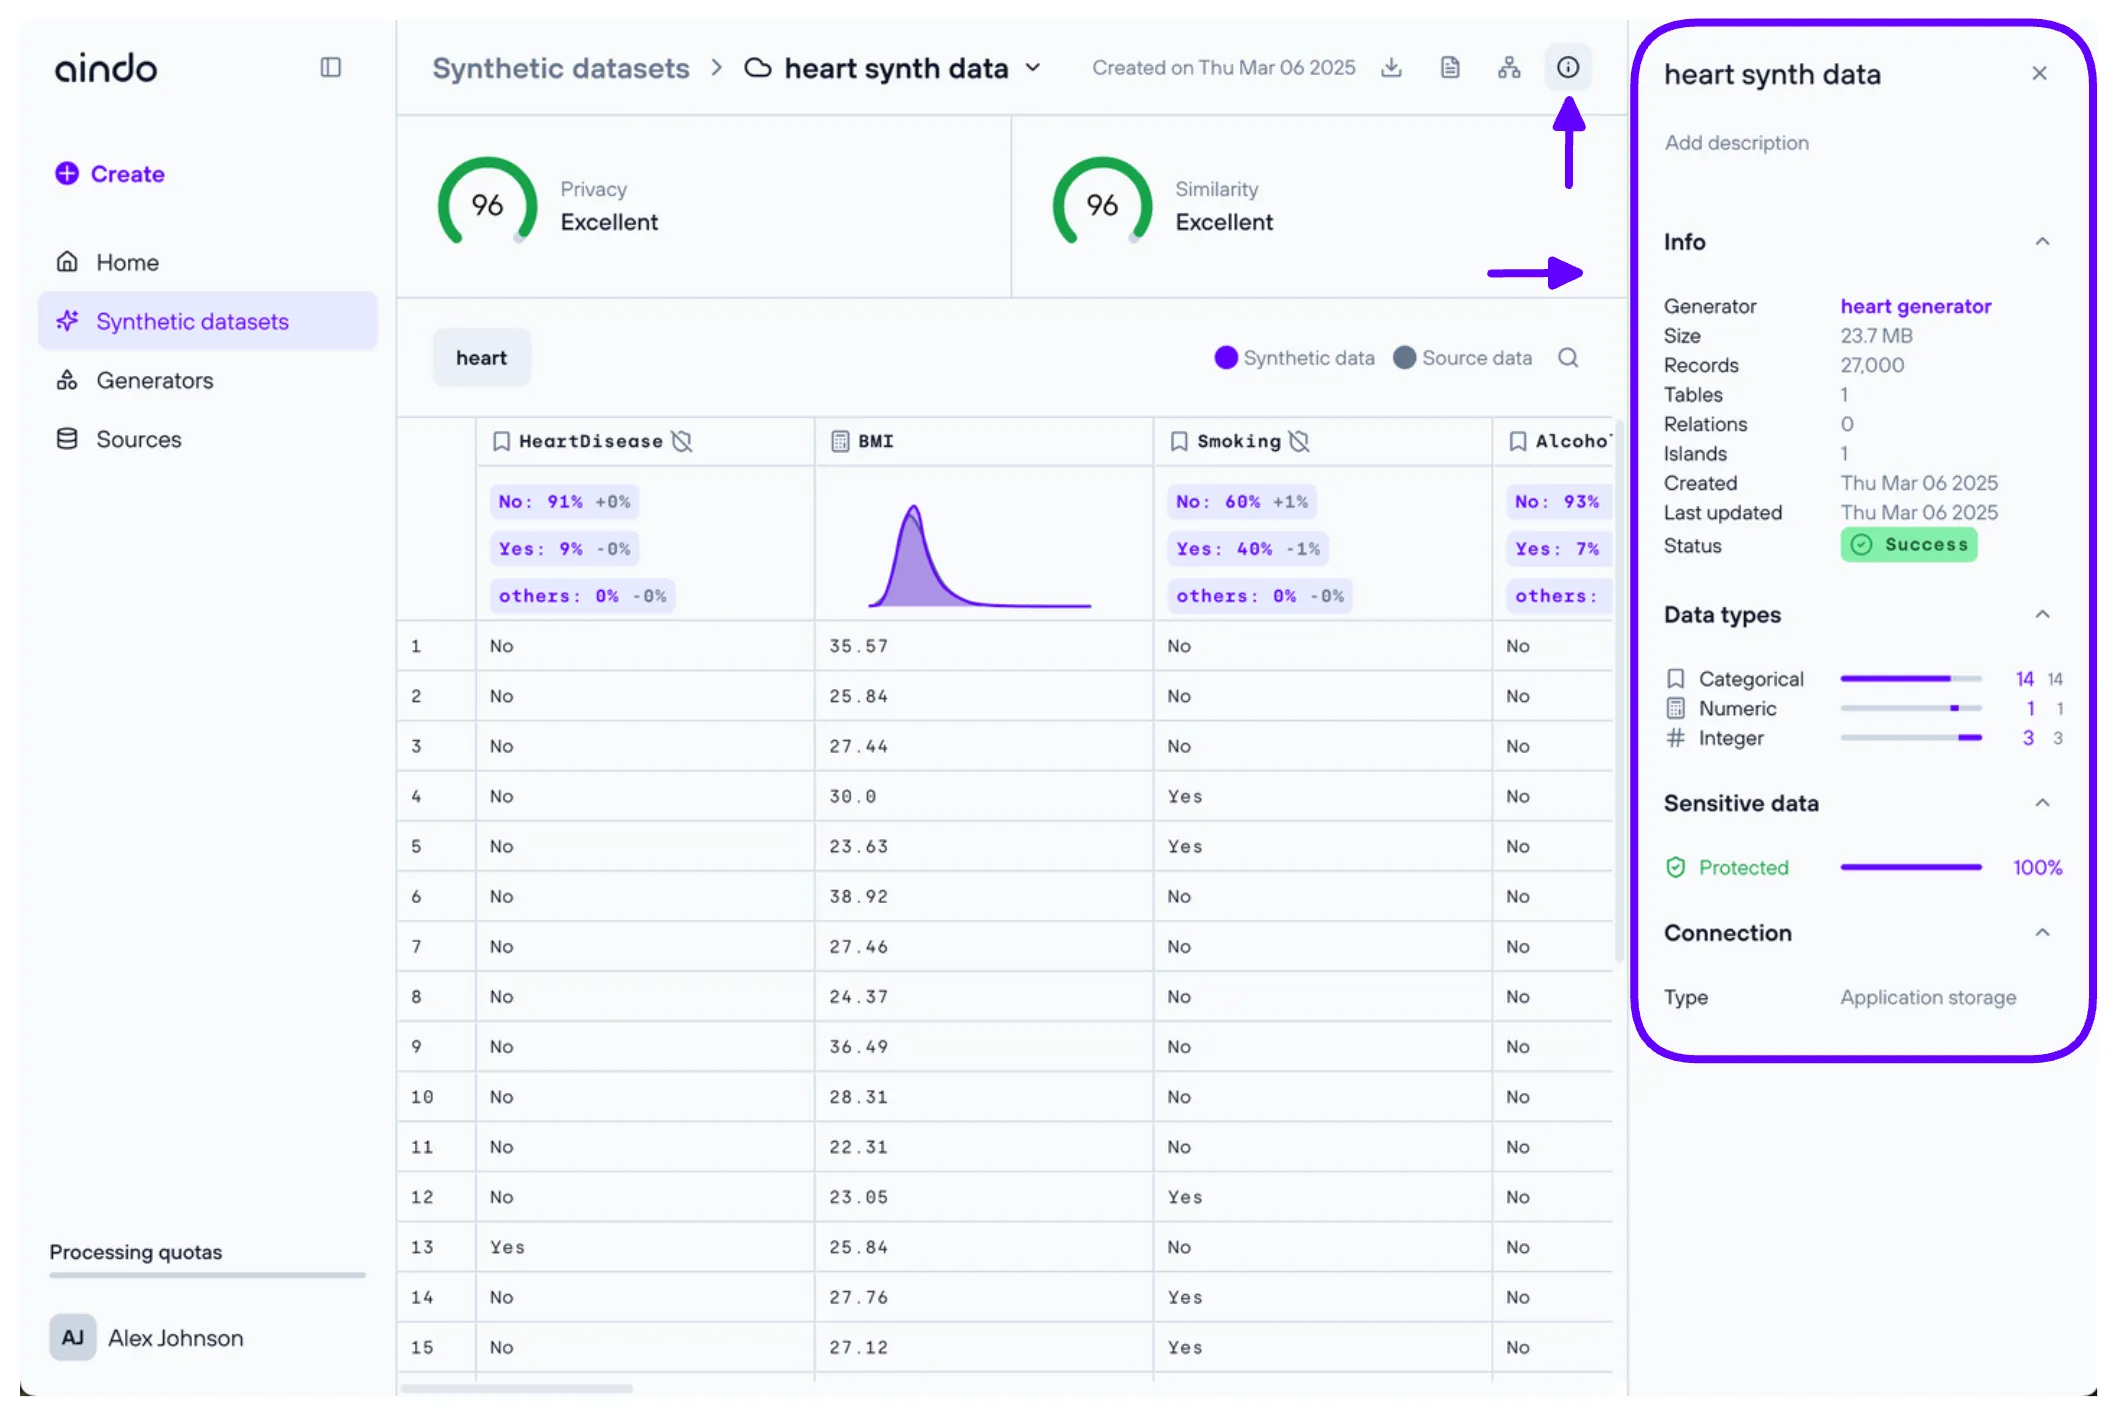
Click the “Info” icon in the top right corner to open a side panel with general details about the generated dataset.
Quick column details
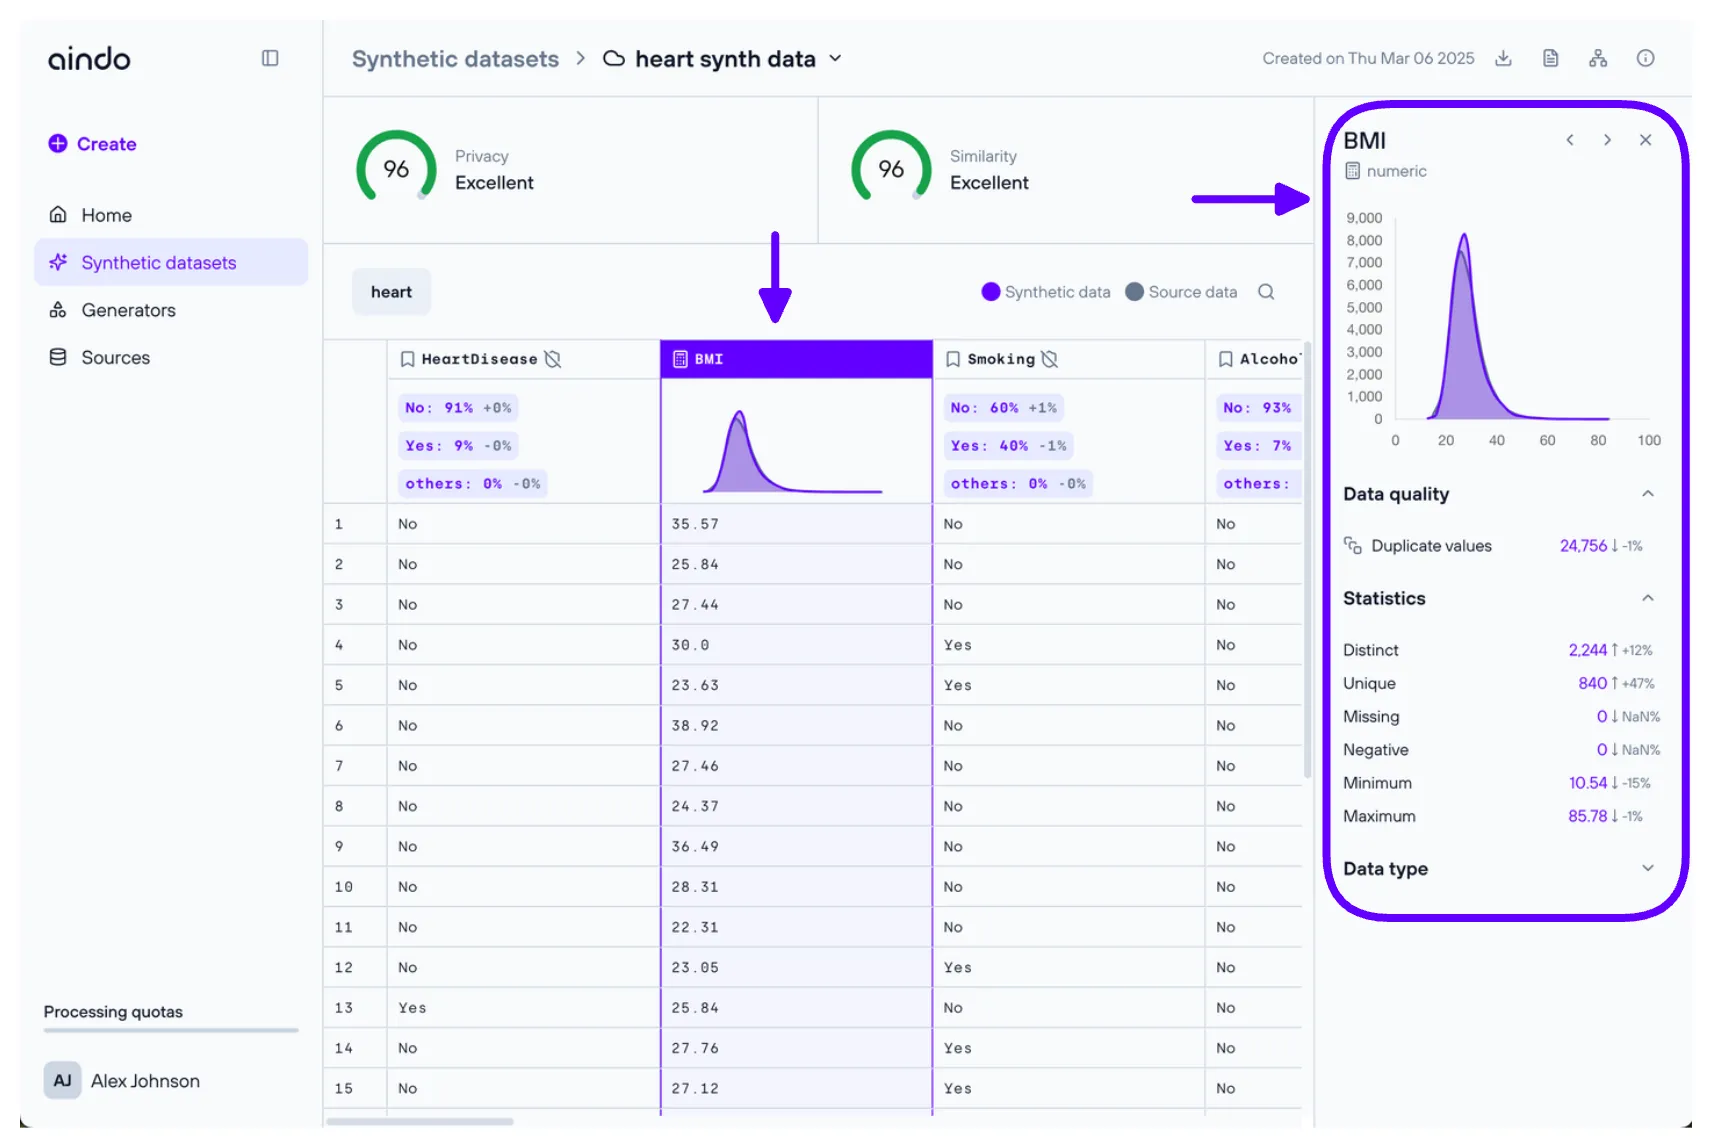
Click on a column to open a side panel displaying detailed statistics and insights about the selected column.
Quick table details
Click on the table name to open a side panel with more in-depth information about the selected table.